Agriculture - 2nd quarter of 2010
Moderate year-on-year decrease in meat production and milk collection
Publication Date: 29. 07. 2010
Product Code: r-2101-10
In the 2 nd quarter of 2010, 136 593 tonnes of meat were produced and 585 478 thousand litres of milk were purchased; i.e. a decrease in both meat production (by 3.4 %) and milk collection (by 2.4 %) y-o-y. The production declined in all of main kinds of meat: in beef, pig meat, and poultry (by 1.4 %, 4.6 %, and 2.3 %, respectively).
* * *
Slaughtering and meat production
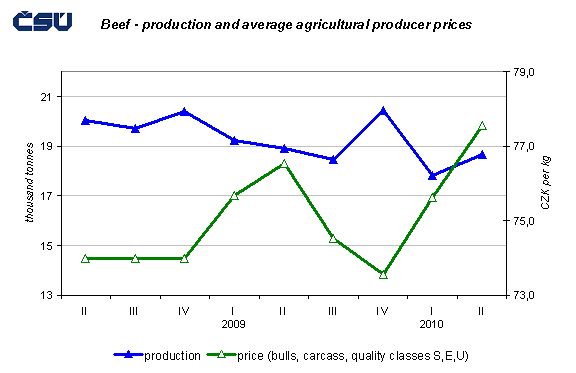
In the 2 nd quarter of 2010, number of cattle for slaughter decreased y-o-y by 3.6 %, of which number of slaughtered bulls, cows, heifers, and calves declined by 4.4 %, 2.4 %, 9.6 %, and 14.3 %, respectively. Beef production (including veal) was y-o-y lower by 1.4 % and it counted for 18 641 tonnes.
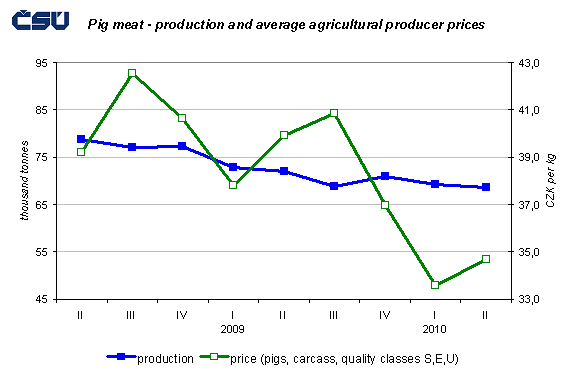
Pig meat production declined y-o-y by 4.6 %, while number of pigs for slaughter went down (by 5.7 %) but number of slaughtered sows went up (by 2.6 %). In total, 68 603 tonnes of pig meat were produced in 2 nd quarter.
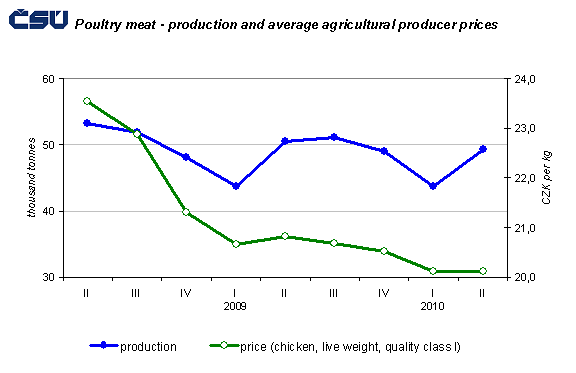
Total production of poultry meat reached 49 316 tonnes; it was lower by 2.3 % compared with the same period of the last year.
Results of cattle, pig and poultry rearing
According to livestock enumeration at April 1 st 2010, cattle numbers decreased y-o-y by 1.0 % to 1 349.3 thousand heads, of which a total number of cows declined by 1.5 % to 551.2 thousand heads, whereas a number of suckler cows rose by 4.6 % to 167.7 thousand heads.
Pig numbers were lower by 3.2 % than in the same period of the previous year; they went down by 62.2 thousand heads to 1 909,2 thousand heads in total. Number of sows declined by 6.7 % (by 9.5 thousand heads), whereas a number of gilts increased by 5.3 % (by 2.9 thousand heads).
Poultry numbers decreased by 6.2 %, of which number of hens only by 3.8 %; in contrary to waterfowl and turkeys, whose numbers fell by 20.0 % and 21.3 %, respectively. At 1 st April 2010, a total number (for all categories - breeding, laying, and for slaughter) counted for 41 681.1 thousand heads in chickens, 18.8 thousand heads in geese, 401.7 thousand heads in ducks, and 376.1 thousand heads in turkeys.
Agricultural producer prices of cattle, pigs, and chickens for slaughter
In the 2 nd quarter, agricultural prices of cattle for slaughter decreased in average by 4.9 % in heifers, by 4.3 % in cows, by 0.9 % in bulls (in total), and by 0.7 % in calves. The average price of bulls for slaughter in S, E, and U quality classes reached CZK 77.56 per kg in carcass weight or CZK 39.97 per kg in live weight.

Agricultural producer prices of pigs for slaughter fell by 12.5 % y-o-y. The average price of pigs for slaughter in S, E, and U quality classes in the 2 nd quarter was CZK 34.67 per kg of carcass weight or CZK 26.71 per kg of live weight.

Agricultural producer prices of chickens for slaughter declined y-o-y (by 3.4 %). The average price of the 1 st –quality chickens for slaughter was CZK 20.12 per kg of live weight.

Foreign trade 1) in live animals and meat
According to preliminary results, foreign trade in live animals in the period of March to May 2010 reached a positive balance of 10 112 tonnes in cattle, 6 771 tonnes in poultry a negative balance of 1 007 tonnes in pigs.
Import of live cattle dropped markedly by 34.4 % to 429 tonnes, and export decreased by 3.7 % to 10 541 tonnes compared to the same period of the previous year. A proportion of animals for slaughter counted for 81.9 % of the total import and 56.1 % of the total export. Live cattle was imported predominantly from Slovakia (83 %), considerably lesser from Germany (12 %) and exported mainly to Austria (52 %), and to a lesser extent to Germany (12 %) and other countries.
Import of live pigs went down by 5.0 % (to 5 538 tonnes), but export in this commodity was higher by 99.5 % y-o-y (4 532 tonnes in total). Animals for slaughter counted for 47.4 % of the total import and 92.9 % of the total export. Live pigs were imported from Denmark (47 %), the Netherlands (26 %), and Germany (14 %); exports went to Hungary (61 %) and Slovakia (31 %).
Import and export of live poultry declined y-o-y to 1 424 tonnes (by 20.5 %) and to 8 194 tonnes (by 19.4 %), respectively. Most of live poultry was imported from Slovakia (83 %) and Germany (15 %); imports were directed to Germany (50 %), Poland (29 %), and Slovakia (14 %).
Foreign trade in meat was negatively balanced; deficits counted for 3 500 tonnes in beef, 36 972 in pig meat, and 12 271 tonnes in poultry.
Import of beef increased by 8,6 % (to 4 696 tonnes); export declined by 13,6 % (to 1 197 tonnes). It was imported mainly from Poland (32 %), Germany (25 %), Ireland (15 %), and Austria (11 %) and exported to Austria (29 %), Slovakia (28 %), Poland (22 %), and Germany (14 %).
Import of pig meat was by 5.3 % higher (45 597 tonnes in total) and export was by 6.1 % lower (8 625 tonnes in total) than in the same period of the last year. Imported pig meat came from Germany (53 %) and with a proportion of the total import less than 10 % from other countries. Most of pig meat was exported to Slovakia (87 %).
Similarly to beef and pig meat, foreign trade in poultry was balanced negatively; nevertheless, there were inverse interannual changes in its import and export: import of poultry declined (18 888 tonnes, i.e. by 3.3 %) and export rose (6 617 tonnes, i.e. by 6.6 %). Poultry came mainly from Poland (39 %) and Brazil (15 %), and went to Slovakia (40 %), Germany (19 %), and the Netherlands (16 %).
Milk collection and agricultural producer prices of milk
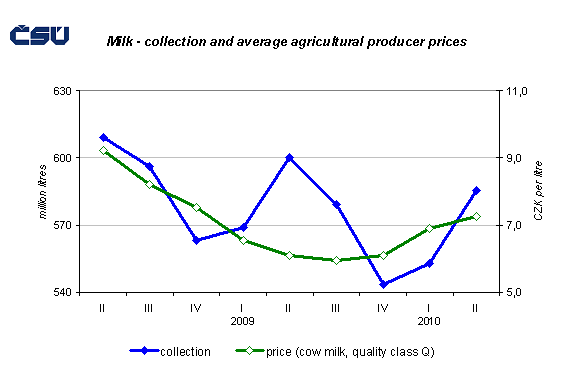
In the 2 nd quarter of 2010, dairies collected 585.5 million litres of milk. It was by 2.4 % less than in the same period of the previous year, but by 5.9 % more than in the previous quarter.
Agriculture producer prices of milk went up by 18.8 % y-o-y. Milk of the Q-quality was collected for an average price of CZK 7.24 per litre.

Foreign trade 1) in milk and milk products
Foreign trade in milk and milk products in the period of March to May 2010 showed an active balance (130 492 tonnes), while both import and export decreased y-o-y, import by 15.3 % (to 66 006 tonnes) and export by 10.0 % (to 196 498 tonnes).
Import considerably dropped (by 43.1 %) in milk on the contrary to import of fermented or acidified milk products and cheese or curd increased (by 11.1 % and 12.3 %, respectively). Export of milk and fermented or acidified milk products went down (by 10.2 % and 4.3 %, respectively), export of cheese and curd rose (by 22.9 %). Milk and milk products were imported in particular from Germany (39 %), Slovakia (27 %), and Poland (22 %); they were exported to Germany (55 %), Slovakia (17 %) and to other countries (each less than 10 %).
Text not edited for language.
1) Intrastat does not include individual trading operations carried out by persons who are not registered for VAT as well reporting units below the applicable thresholds of CZK 8 million a year for both flows since January 1st, 2009 (formerly CZK 4 million for dispatch and CZK 2 million for arrival) are not under reporting duty for Intrastat.
Methodical note:
Contact person: Jiří Hrbek, phone 27405 2331, e-mail: jiri.hrbek@csu.gov.cz
Source: full survey carried out by the Czech Statistical Office, Agricultural Producer Price Indices in June 2010 (CZSO).
Milk collection and purchase of poultry – survey conducted by the Ministry of Agriculture.
Date of completing data collection: July 10 th , 2010
Date of completing data processing: July 27 th , 2010
Published data are final with the exception of foreign trade data.
Following tables: /katalog-produktu
