Analysis - Consumer price indices - 2nd quarter of 2011
Publication Date: 12. 07. 2011
Product Code: a-7155-11
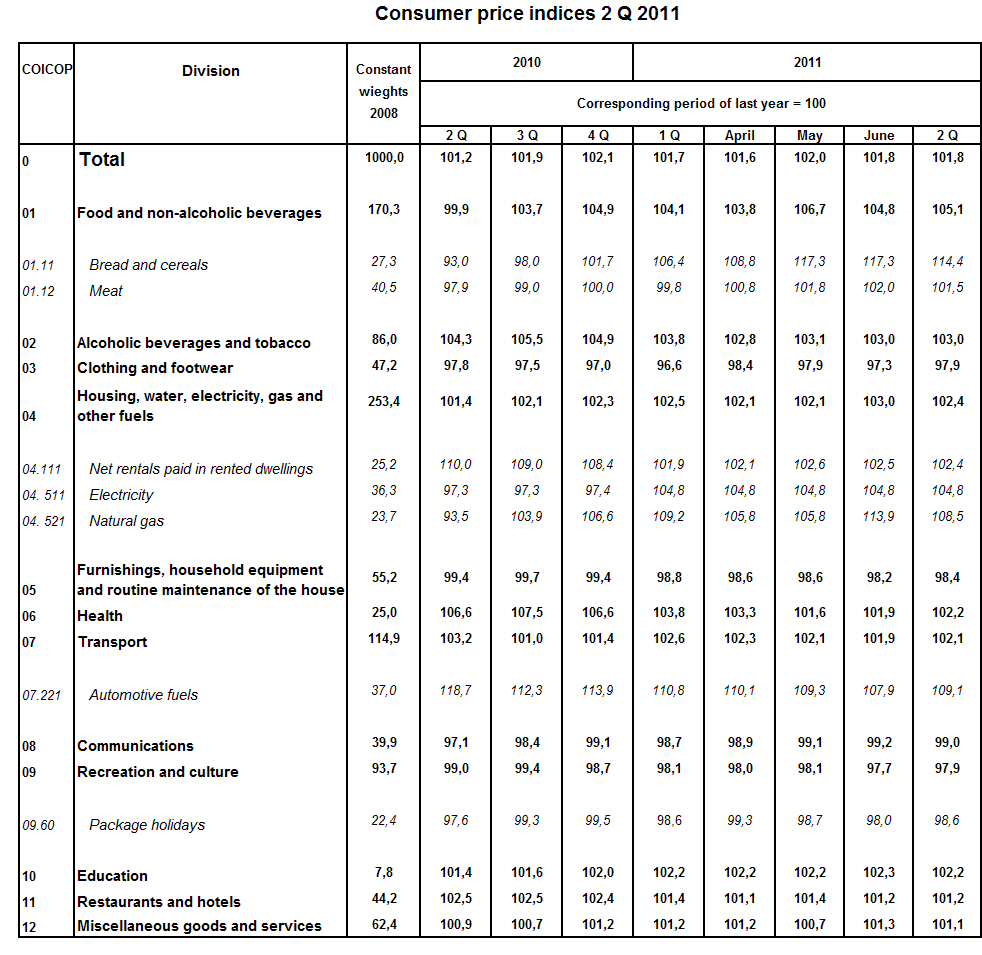
Consumer prices increased by 0.6% in Q2 2011 compared with Q1 2011 while market prices were up by 0.5% and regulated prices *) rose by 0.6%.
The quarter-on-quarter (q-o-q) price level increase was affected especially by a price increase in four divisions of the consumer basket, namely in 'food and non-alcoholic beverages', 'clothing and footwear', 'health', and 'transport'.
The development of food prices came primarily from an increase in prices of bread and cereals and, on the other hand, from a marked drop in prices of vegetables cultivated for their fruit in June. The growth in prices of 'clothing and footwear' came either from higher prices of new summer models and either from the smaller extent of discount sales. In 'health' seasonal prices of stays at spas increased. A growth of automotive fuel prices continued in 'transport'. In 'housing, water, electricity, gas and other fuels' prices of natural gas has risen since June.
The average month-on-month (m-o-m) growth rate in Q2 2011 was 0.2%; in Q2 2010 it was 0.1%. This was demonstrated in a moderate acceleration of the year-on-year (y-o-y) price increase
in Q2 2011.
Consumer price indices
the previous quarter = 100
2010 | 2011 | ||||
DIVISION | Q2 | Q3 | Q4 | Q1 | Q2 |
| TOTAL | 100.6 | 100.1 | 99.8 | 101.2 | 100.6 |
| Food and non-alcoholic beverages | 100.6 | 99.5 | 101.0 | 102.9 | 101.6 |
| Alcoholic beverages and tobacco | 101.2 | 101.2 | 99.9 | 101.5 | 100.4 |
| Clothing and footwear | 101.5 | 96.4 | 102.7 | 96.3 | 102.7 |
| Housing, water, electricity, gas and other fuels | 100.4 | 100.5 | 100.0 | 101.7 | 100.3 |
| Furnishings, household equipment, and routine maintenance of the house | 100.0 | 99.7 | 99.5 | 99.6 | 99.7 |
| Health | 102.6 | 101.3 | 99.6 | 100.3 | 101.1 |
| Transport | 101.6 | 99.2 | 99.6 | 102.2 | 101.1 |
| Communications | 99.6 | 99.3 | 99.9 | 100.0 | 99.9 |
| Recreation and culture | 99.6 | 102.4 | 96.1 | 100.1 | 99.5 |
| Education | 100.0 | 100.6 | 101.3 | 100.2 | 100.1 |
| Restaurants and hotels | 100.7 | 100.3 | 100.1 | 100.4 | 100.4 |
| Miscellaneous goods and services | 99.9 | 100.4 | 100.3 | 100.6 | 99.7 |
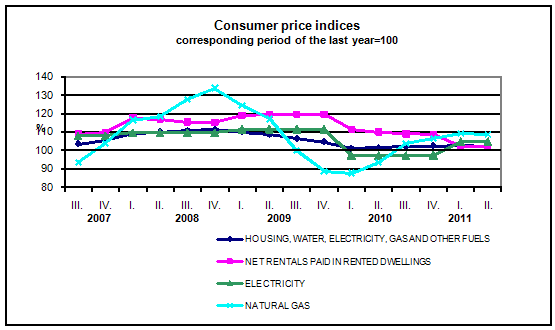
Consumer prices increased by 1.8%, year-on-year in Q2 2011 compared to Q2 2010, which was by 0.1 percentage point (p.p.) more than in Q1 2011. An acceleration of the price growth occurred only in 'food and non-alcoholic beverages'. Two divisions of the consumer basket - 'clothing and footwear' and 'communications' – showed a slowdown in the y-o-y drop in prices and consequently their influence on the price level reduction was lower. A deceleration of the price growth at different rates or a deepening of their price drops was recorded for other divisions. The year-on-year growth of market prices was the same as in Q1, i.e. 1.3% and that of regulated prices amounted to 4.0%.
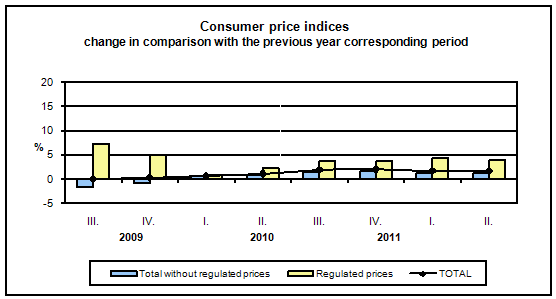
Prices of bread and cereals increased markedly in ' food and non-alcoholic beverages'. Prices of bread rose by 15.1% and prices of rolls and baguettes by 29.0%. The last time, when prices of both the items were higher, occurred in 2008. A high y-o-y growth in prices, which got even increased in Q2, continued for flour, milk, butter, edible oils, vegetable fats, sugar, and coffee. On the other hand, prices of vegetables cultivated for their fruit (tomatoes, cucumbers, and green peppers) dropped by 25.0% due to their marked decrease in June. Prices of rice, eggs, citrus fruit, bananas, stone fruit, and berries were lower than in the previous year.
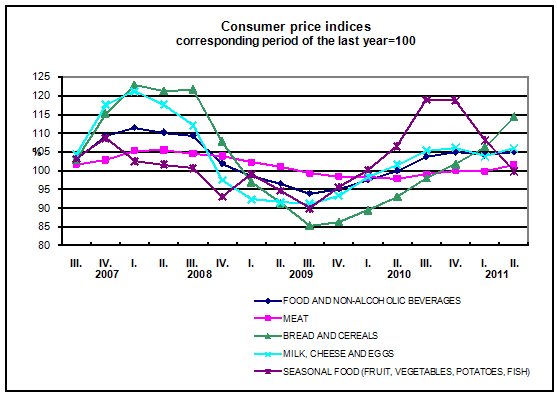
A negligible slowdown of the y-o-y price growth in ' housing, water, electricity, gas and other fuels' was affected by natural gas prices, which were higher by 8.5%, while in Q1 2011 they rose by 9.2%. This slowdown was caused by a time shift in the rises in natural gas prices, which occurred in different time in the previous year (since April) and in this year (since June). Prices of electricity increased by 4.8%, the same way as in Q1. The net actual rentals increased by 2.4% (from 1.9% in Q1), of which for dwellings with regulated rentals was higher by 5.9% and for dwellings with market rentals by 0.9%.
In ' alcoholic beverages and tobacco' the y-o-y price growth in alcoholic beverages slowed down in Q2 2011 to 2.0% from 2.6% in Q1 2011 and in tobacco products to 3.9% from 4.9%.
In ' health' the increase in prices and supplementary payments for pharmaceuticals prescribed by doctor was mitigated to 1.7% (from 5.1% in Q1 2011) due to a lower increase in prices in Q2 2011 compared with Q2 2010.
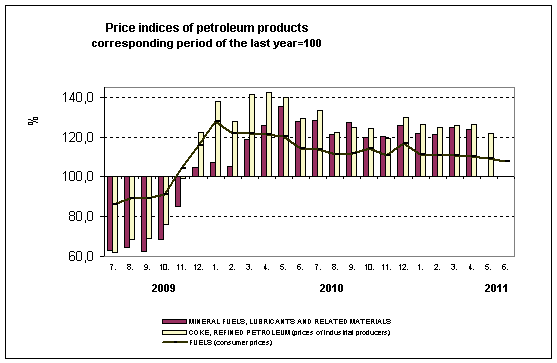
In ‘ transport’ the price development was affected primarily by automotive fuel prices, which were steadily increasing in all quarters, but Q3 2010, of 2010 and 2011 so in Q2 2011 they reached their historical maximum. However, their growth rate was more marked in 2010 than in 2011, which led to a slowdown of the y-o-y increase in automotive fuel prices to 9.1% (from 10.8% in Q1). The development of consumer prices of automotive fuels in relation to prices of industrial producers and import prices of petroleum products are depicted in the graph below.
The year-on-year drop in prices, which, however, decelerated in Q2, continued in ‘clothing and footwear’ and in mobile phones and services of mobile phone operators as well. On the other hand, a deepening the y-o-y decrease was recorded for equipment and household appliances, furthermore for equipment for the reception, recording, and reproduction of sound and image.
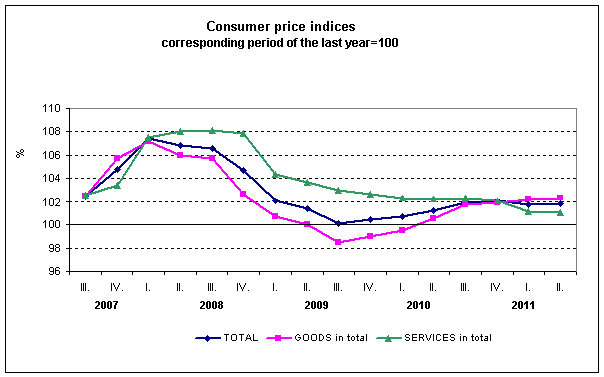
Prices of goods in total grew by 2.3% (from 2.2% in Q1) and the growth in prices of services slowed down to 1.0% (from 1.1% in Q1). It is clear from the graph that prices of services thus grew slower than prices of goods after a four-year period.
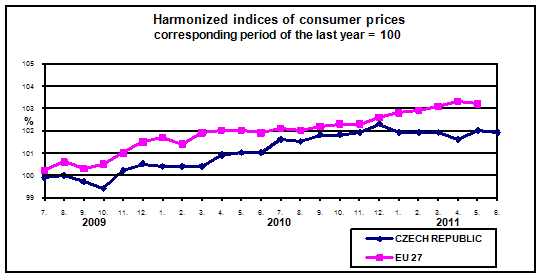
Harmonized index of consumer prices in the EU27
According to Eurostat preliminary data the year-on-year increase in the average harmonized index of consumer prices (HICP) in the EU27 was 3.3% in April and 3.2% in May. In the Czech Republic the HICP y-o-y change of was 1.6% and 2.0% in the same months, respectively. According to preliminary data the HICP increment in the CR slowed down to 1.9% in June. It is clear from the graph that the y-o-y HICP in the CR has been lower than the average HICP in the EU27 Member States for a long-term and their difference even slightly increased in 2011.
_____________________________________
*) Goods and services prices of which are partly or entirely regulated.
