Development of consumer price indices - 3. quarter of 2008
Product Code: e-7132-08
Consumer prices grew in Q3 2008 compared with Q2 2008 by 0.7 %, of which regulated prices increased by 2.7 % and market prices by 0.1 %.
The growth of regulated prices came mainly from price increase in tobacco products, which was, to a considerable extent, due to the excise tax increase from January 2008. In 'housing, electricity, water and other fuels' (hereinafter 'housing') prices of natural gas went up by 9.7 %. Prices of medicines and additional payments for medicines rose by 2.1 %.
The market price development was affected especially by price increase in 'recreation and culture' where prices of package holiday were 12.6 % up as a result of seasonal increases in July and August. In 'hotels and restaurants' in Q3 higher were especially prices of meals and beverages provided in restaurants by 1.0 % and prices of accommodation services by 1.1 %. Higher were also prices of educational services due to their increase in September. In food products a price rise was recorded namely for rice (20.6 %), pork (4.3 %), vegetable oils (6.2 %), pulses (16.4 %), chocolate and chocolate products (5.3 %).
Market price decreases came mainly from price drop in clothing by 1.7 % and footwear by 2.3 % caused especially by summer sales of clothes and shoes. Lower were prices in food and non-alcoholic beverages mainly due to price decrease of fruit by 7.3 %, vegetables incl. potatoes by 14.0 %, milk, cheese and eggs by 2.4 %. In 'post and telecommunications' prices dropped owing to price reductions offered by some mobile operators. Lower were also prices of household appliances, transport equipment and electronic equipment for the reception, recording and reproduction of sound and pictures, photographic and cinematographic equipment and personal computers.
Consumer price indices
Previous quarter = 100
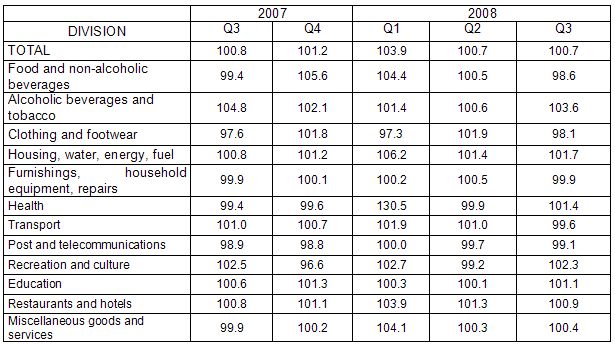
In the year-on-year development the consumer prices increased in Q3 2008 compared with Q3 2007 by 6.6 %, which is by 0.2 p.p. less than in Q2. The regulated price**) goods and services whose prices are partly or entirely regulated and indirect tax adjusted ) growth was the same as in Q2, i.e. 21.5 % and market price growth decelerated to 3.1 % (from 3.3 % in Q2 2008).
A slowdown in the y-o-y growth was recorded in Q3 primarily in ' alcoholic beverages and tobacco' where the y-o-y growth of tobacco prices decelerated to 11.4 % (from 14.3 % in Q2) due to faster growth of cigarette prices in Q3 2007 compared to Q3 2008.
In transport, the y-o-y slowdown of price development came especially from fuel prices, which were 6.0 % up (in Q2 2008 8.5 %). Prices of fuel were falling in all three months of Q3 and in September they recorded the lowest level over the last five months. Prices of motorcars, motorcycles and bikes fell (by 4.7 %, 4.5 % and 4.9 %, respectively). In contrast, prices in public transport went up by 11.5 %.
Development of consumer prices of fuel like import prices of mineral fuels and industrial producer prices of refined petroleum products responded to the world oil price development. Strengthening of the CZK exchange rate against USD had a favourable impact on fuel prices.
A slow-down of the y-o-y price growth reflected also in ' food and non-alcoholic beverages' due to seasonal prices of fruit, which were 4.1 % up (in Q2 13.7 %). Prices in the product group including milk, cheese, eggs rose by 12.1 % (in Q2 by 17.7 %), prices of butter were 4.6 % up (in Q2 12.3 %) and prices of poultry increased by 4.2 % (in Q2 14.9 %). In contrast, for some kinds of food the present big price growth has even strengthened. Prices of rice rose by 54.3 % (in Q2 by 28.9 %), prices of vegetable oils by 30.5 % (in Q2 by 22.3 %) and of pulses by 42.3 % (in Q2 by 20.4 %).
In ' housing, electricity, water and other fuels' price growth speeded up mainly due to the natural gas price increase by 9.7 % in July 2008 which resulted in the y-o-y growth in Q3 to 27.7 % from 18.4 % in Q2. Net rentals increased by 15.4 %, of which for dwellings with regulated rentals by 23.6 % and for dwellings with market rentals by 3.1 %. Prices of electricity increased by 9.5 %, prices of heat and hot water by 11.2 % and prices solid fuels by 20.0 %. Prices of water supply and sewerage water charges were up by 8.3 % and 9.1 %, respectively.
In ' hotels and restaurants' the price growth owed mainly to the VAT increase in food and meals provided in restaurants in January 2008. Prices of meals served in restaurants increased by 6.7 %, in canteens by 8.7 % and school canteens by 10.6 %.
The price growth in ' recreation and culture' was due mainly to seasonal prices of package holiday, which, like in previous years in June and August recorded a marked m-o-m growth while in September they fell notably. These movements resulted into y-o-y slow-down of prices of package holiday in Q3 2008 to 0.6 % (from 1.5 % in Q2). Lower than in 2007 were also prices of electronic equipment for the reception, recording and reproduction of sound and pictures, photographic and cinematographic equipment and personal computers.
In education the price growth speeded up due to regular price increases in September as the new school year stated.
The y-o-y price drop occurred in clothing and footwear, where prices of clothes decreased by 1.6 %. Despite an increase in prices of postal services from January 2008, a price decline occurred in 'post and telecommunications' owing to price decrease in mobile phones and price reductions offered by mobile phone operators.
Price increase of goods in total slowed down to 5.7 % (from 6.0 % in Q2 2007) and prices of services speeded up to 8.1 % (from 8.0 % in Q2).
Harmonized index of consumer prices in the EU 27
According to preliminary data, the year-on-year increase in the average harmonized index of consumer prices (HICP) in the EU27 was 4.4 % in July and 4.2 % in August. Prices grew most in Latvia (by 16.5 % and 15.6 %) and in Bulgaria (by 14.4 % and 11.8 %). The lowest inflation was registered in the Netherlands (3.0 %). In Slovakia the price growth was 4.4 % in both months. In Germany the HICP in the above months was 3.5 % and 3.3 %. In the CR the y-o-y HICP was 6.8 % and 6.2 % and according to preliminary results it stood at 6.4 % in September, which values are significantly bigger that the EU 27 average. This significant difference in price growth started in October 2007 culminated in January 2008 and in the next months it was gradually falling to come nearer to the EU 27 level, which showed, in contrast, an increasing trend.