Analysis - Consumer price indices in the .... quarter of 2009 - 3 quarter
Product Code: q-7132-09
Consumer prices decreased in Q3 2009 compared with Q2 2009 by 0,6 %, during which time market prices dropped by 0,7 % and administratively influenced prices goods and services, prices of which are partially or fully regulated by 0,4 %.
The development of market prices was influenced primarily by the decrease in food prices and the prices of clothing and footwear. Among food, lower were particularly, according to the summer season, the prices of fruits, by 12,1 %, and prices of vegetables including potatoes, by 18,9 %. Prices of bread and cereals dropped by 6,1 %, prices of products of the group milk, cheese, eggs by 2,6 %, oils and fats by 1,6 %. The decrease of both clothing and footwear was caused mainly by sales of summer goods. A price decrease was also observed in bikes by 5,4 %, mobile phones by 4,7 %, audio-visual and photographic equipment and computers by 2,6 %. A significant rise showed particularly the prices of automotive fuel, which increased by 4,8 %, quarter-on-quarter.
The lowering of natural gas prices by 6,3 % influenced the decrease of regulated prices. On the contrary, net rent for rented flats increased by 1,5 %, of which for dwellings with regulated rentals by 1,9 %, while for dwellings with market rentals by 0,4 %.
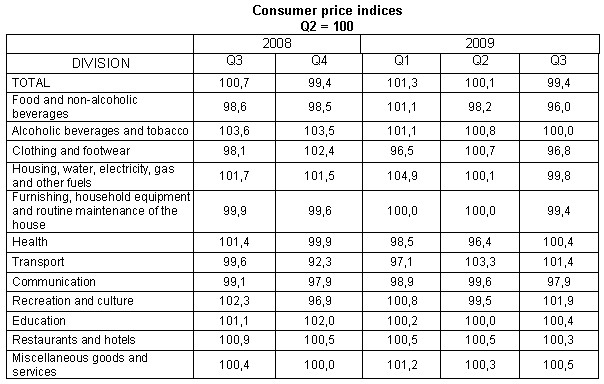
In terms of the year-on-year comparison, in the particular months of Q3, a marked deceleration of the rise of consumer prices continued; it closed in September on the zero value. Consumer prices increased in Q3 2009, compared to Q3 2008, by 0,1 % only (in Q2 2009 by 1,4 %), which is the lowest rise since Q3 2003. The rise of administratively influenced prices decelerated to 7,2 % (from 9,4 % in Q2), market prices dropped by 1,7 % (in Q2 by 0,6 %).
The deceleration of the price increase or the acceleration of the price decrease was registered in 10 of the 12 divisions of the consumer basket. It was the result primarily of the price decrease in Q3 2009, but in some items it was caused also by a faster increase in Q3 2008. The average increase in the month-on-month terms was 0,1 % in Q3 2008, while in Q3 2009 prices decreased, m-o-m, by 0,3 % in average.
The deceleration of the price increase occurred primarily in the two divisions of the consumer basket, which had showed a most marked price increase in the last years, respectively in the division housing, water, electricity, gas and other fuels and in the division alcoholic beverages and tobacco. In housing, in contrast to year 2008, when the price of natural gas increased at the beginning of every quarter, a double price reduction occurred in 2009. This lead to a stepwise moderation of the y-o-y price increase, which was reduced to 0,0 % in Q3 (from 17,1 % in Q2). The y-o-y increase in the electricity price by 11,6 % and in the net rent by 19,5 % (of which in the dwellings with regulated rental by 27.1 % and in dwellings with market rental by 5,2 %) was equal or almost equal to the increase in the Q1 2009. This is given by the fact that prices of these items are usually raised mostly once in a year and at the beginning of a year. Electricity prices show in the long term a smooth increase by about 10 %, while natural gas prices as well as prices of automotive fuel are liable to the variations caused by external factors.
The deceleration of the y-o-y price increase in the division alcoholic beverages and tobacco was the result of the moderation of the increase of cigarettes prices to 8,9 % (from 15,1 % in Q2). It was caused by a marked growth of these prices in the second half of 2008, influenced by a higher excise tax since January 2008 (the mean growth rate in Q3 2008 was 3,2 %, in Q3 2009 the rate was 0,2 %).
In education, the price increase decelerated due to the traditional raise in September, which was in 2009 less marked than in the previous year.
Similarly in restaurants and hotels the price increase in school canteens and accommodation in boarding schools was slower than in the previous year. The increase decelerated also in restaurants, works canteens and in accommodation services.
The decrease of the total price level was primarily the result of the decrease in the division food and non-alcoholic beverages, where the deepening of the y-o-y price decrease caused by a permanent lowering of food prices since February 2009 continued. This development influenced also a marked decrease of agricultural producer prices by end 2008, which continued in 2009.
Prices of bread cereals dropped by 14,7%, oils and fats by 8,1 %, products in the group milk, cheeses and eggs by 8,8 %, fruit by 14,5 % vegetables by 8,4 %.
The price decrease, which started in October 2008, continued in transport, but slightly moderated in Q3. The reason was the permanent increase in automotive fuel prices (with the exception of September), which lead to a mitigation of the fall of prices incurred in the last quarter 2008. In Q3, prices of automotive fuels were y-o-y lower by 11,8 % (in Q2 by 15,7 %).
The y-o-y decrease of prices was noted also in the divisions clothing and footwear mainly as a result of season and action sales of dealers. Similarly in the division communication the process of lowering the prices of mobile phones and services of mobile operators continued.
The development of prices in the division recreation and culture was influenced namely by seasonal prices of package holidays, whose prices had markedly increased m-o-m in July and August every year in the past and markedly decreased in September. In 2009, the price moves in July and August were softened by series of reductions, which, on the contrary, lead to an even more marked decrease in September. The result was a y-o-y decrease of the prices of holidays with complex services in September in Q3 2009 by 1,7 % (in Q2 prices increased by 0,7 %). A lasting y-o-y decrease was observes for electronic equipment for the reception, record and reproduction of audio and video, photographic and cinematographic equipment and personal computers.
Prices of total goods decreased by 1,5 % (after a zero growth in Q2) and the increase of prices of services decelerated to 3,0 % (from 3,7 % in Q2 2009).
Harmonized index of consumer prices in EU-27
The deceleration of the price increase, which passed over to a y-o-y decrease in a lot of countries, took effect in all member states of the EU. The lowest y-o-y increase of the mean harmonized index of consumer prices (HICP) in EU-27 was 0,2 % in July, in August, according to preliminary data, the growth accelerated to 0,6 %. In the Czech Republic, the y-o-y change of HICP was –0,1 % and 0,0 % in these months. In July and August, prices decreased mostly In Ireland by 2,6% or 2,4 %. On the contrary, the biggest increase was observed in Hungary and Romania (by 4,9 % or 5,0 %).