Analysis - Consumer price indices in the .... quarter of 2009 - 2 quarter
Product Code: q-7132-09
Consumer prices increased in Q2 2009 compared with Q1 2009 by only 0.1 % and so did market prices (+0.1%) while, by contrast, regulated prices * ) fell by 0.2%.
The market price development was affected mainly from two market controversial price wobbles, i.e. the growth of fuel prices and fall of food prices. Fuel prices increased, q-o-q, by 9.7%. In food and non-alcoholic beverages, lower were prices of bread and cereals by 4.8%, meat by 0.6%, products in the group milk, cheese and eggs by 3.1%, oils and fats by 3.0%, fruit by 2.8%, vegetables grown for fruit by 16.7%. On the other hand, prices of potatoes increased by 27.7% due to a switch from old to new potatoes.
Drop of regulated prices came from a 3.0% price decrease of natural gas and price drop in health, which was due to changes in the system of regulatory fees payment. Additional payments for medicines prescribed by doctors including fees fell by 12.3%, prices of in-patient care by 11.3%. By contrast, the net actual rentals in rented dwellings increased by 1.2%, of which in dwellings with regulated rentals by 1.2% and in dwellings with market rentals by 1.1%.
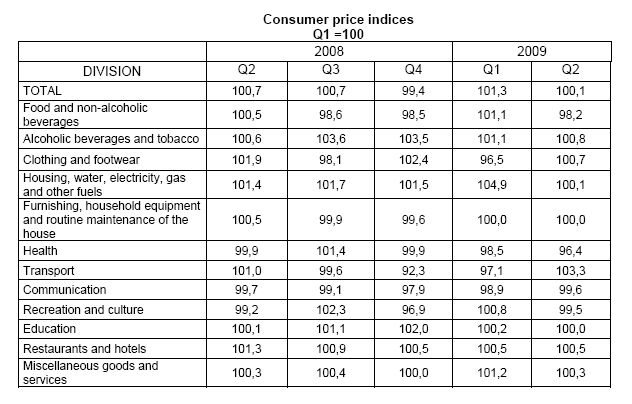
In the year-on-year comparison, marked deceleration of consumer prices growth continued to reach the values of Q1 and Q2 2007. Consumer prices increased in Q2 2009 compared to Q2 2008 by 1.4% (in Q1 2009 by 2.1%). The regulated price growth slowed down to 9.7% (from 10.7% in Q1), market prices dropped by 0.5% (in Q1 zero growth was recorded).
Deceleration of price growth was affected by a different m-o-m price development in Q2 2009 and 2008. While in Q2 2009 prices in total stagnated (the average y-o-y growth rate was 0.0%), in Q2 2008 prices grew, y-o-y, by 0.3%, on average. This effect, i.e. the deceleration of price growth and deepening of price drop showed to a different extent in all sections of the consumer basket.
A slow down in the price growth was reported for ' housing, electricity, water and other fuels', which contributes most to the growth of price level. The slow down came from the natural gas price drop by 3.0%, which showed in deceleration of its y-o-y growth to 17.1% (from 24.3% in Q1). The y-o-y growth of prices of other housing items remained more or less on the level of Q1. Prices of electricity were by 11.6% up, net actual rentals increased by 19.3%, of which in dwellings with regulated rentals by 27.1% and in dwellings with market rentals by 5.2%. Prices of electricity resumed the existing trend (the growth by approximately 10%), while the natural gas prices, like fuel prices, reflect wobbles caused by external factors.
The year-on year profound drop due to price decrease in Q2 2009 and also due to the price increase in Q2 2008 showed in food and non-alcoholic beverages. This trend came also from a significant drop of agricultural producer prices by the end of 2008, which continued in 2009. Prices of bread and cereals fell by 8.7%, oils and fats by 4.9%, fruit by 9.7%, products in the group milk, cheese and eggs by 8.5%.
More marked y-o-y drop in Q2 was reported also for prices in health due to an amendment to the Decree on Regulatory Fees.
The total price level drop was contributed to by prices in transport, however, this effect was mitigated in Q2 due to a constant growth of fuel prices (one of a few items whose prices grew in Q2) resulting in deceleration of the y-o-y price slump in the last quarter of 2008. Fuel prices were in Q2 lower by 15.7%, y-o-y (in Q1 –20.5%).
Small acceleration of the y-o-y growth was recorded for prices in alcoholic beverages and tobacco, which, after housing, contributed most to the total y-o-y price level growth due to the price increase of tobacco products by 15.1%. These developments were affected by the consumer tax increase from January 2008, which raised prices of cigarettes no sooner than in the latter half of 2008, and also a moderate price increase of cigarettes in 2009.
Prices of goods in total showed no changes, y-o-y, and the price growth of services slowed down to 3.7% (from 4.4% in Q1 2009).
Harmonized index of consumer prices in the EU27
The slow down of price growth showed in all EU Member States. The year-on-year increase in the average harmonized index of consumer prices (HICP) in the EU27 slowed down from 1.8% in February to 0.7% in May (according to preliminary data). In the Czech Republic, the y-o-y growth of HICP slowed down from 1.3% to 0.9%, while in some countries, as early as in March, the y-o-y price drop was recorded, which in the following months accelerated. In May price decreases were reported for Ireland (-1.7%), Portugal (-1.2%) Spain and Luxembourg (both -0.9%).
*) goods and services whose prices are either partly or completely regulated