Analysis - Consumer price indices in the .... quarter of 2009 - 1 quarter
Product Code: q-7132-09
Consumer prices increased in Q1 2009 compared with Q4 2008 by 1.3 %. The total increase came from regulated prices*), which raised by 6.0% while market prices as a whole showed no changes.
The growth of regulated prices was recorded, to the prevailing extent, as early as in January and mainly in housing. Prices of electricity increased by 11.6%, q-o-q, prices of heat and hot water by 4.1%, water supply by 9.0% and sewerage collection by 8.8%. In the next stage of deregulation of rentals the net actual rentals in rented dwellings increased by 16.0%, of which in dwellings with regulated rentals by 23.7% and in dwellings with market rentals by 2.1%.
Market prices on average remained the same as in Q4 2009, however the price development in individual kinds of goods and services showed big differences. The price growth in food, beverages and tobacco came mainly from seasonal price increase in fruit by 13.6% and vegetables by 14.4%. On the other hand, prices of rolls and baguettes dropped by 10.0%, flour by 14.5%, fresh milk by 6.5%. The market price development was affected also by price drop in clothing and footwear due to the January sales. An important contribution came also the drop of fuel prices by 9.3%.
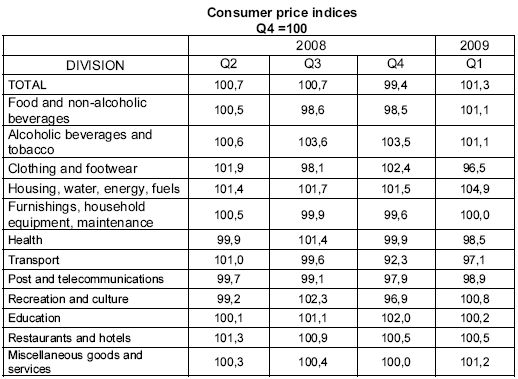
In the year-on-year comparison, in Q1 2009 another significant deceleration of consumer price growth was recorded showing approximately the level, which was usual before Q4 2007. Consumer prices increased in Q1 2009 compared to Q1 2008 by 2.1% (in Q4 2008 by 4.7%). The regulated price increased by 10.7% while market prices recorded a zero growth due to compensation of movements of individual kinds of goods and services on both sides.
The slow-down of price growth was affected by the development of consumer prices in 2009 when the prices hit the high level reached in 2008. Deceleration of price growth or deepening of price drop showed to a different extent in all sections of the consumer basket, mostly in items whose prices increased markedly since January 2008 due to regulation. The biggest change of price development was reported in health where the effect coming from the regulatory fees introduction in January 2008 was eliminated. Like in food, in restaurants and hotels and in other products and services the impact of the VAT increase vanished. In recreation and culture the last year’s increase of TV licence charges ceased to take effect. Zero growth of market prices, however, indicates the influence of global economic crisis, if any, on the Czech economy.
Prices in ' housing, electricity, water and other fuels' whose contribution to the y-o-y increase of price level (2.6 percentage points) covered the price growth for the whole consumer basket. The y-o-y growth of natural gas prices, which in Q4 recorded the biggest increase for the last four years, slowed down in Q1 to 24.3%. Prices of electricity resumed the existing trend (the y-o-y growth by approximately 10%), specifically in Q1 by 11.6%. A moderate intensification was recorded for gradual deregulation of net rentals, which was higher by 19.0%, of which for dwellings with regulated rentals by 26.6% and for dwellings with market rentals by 5.2%.
The second biggest influence on the total y-o-y price growth came from prices in alcoholic beverages and tobacco where prices of tobacco products were 14.1% up due to the excise tax increase from January 2008, which showed mainly in the latter half of 2008 and also due to a moderate increase of cigarette prices in 2009.
The total price level drop (-1.0 percentage point) was contributed to by prices in transport, which was due to price drop in fuel and personal cars. Fuel prices showed an unprecedented drop, y-o-y, by 20.5%, of which in January by 24.6%. In February and March fuel prices began to grow (after a seven-month drop, m-o-m), which contributed to the slow-down of the y-o-y price drop.
Lower, in the year-on-year comparison, were in Q1 2009 (after two years) also prices in food and non-alcoholic beverages due to higher consumer prices of food in the 1st half-year of 2008 and also due to a significant price drop of agricultural producer prices at the end of 2008, which continued in 2009. Prices of bakery and farinaceous products dropped by 3.1%, oils and fats by 1.4%, products in the group of milk, cheese and eggs by 7.7%.
The price growth in goods slowed down to 0.7% in total (from 2.7% in Q4 2008) and price growth in services decelerated to 4.4% (from 7.9% in Q4 2008).
Harmonized index of consumer prices in the EU27
According to preliminary data, the year-on-year increase in the average harmonized index of consumer prices (HICP) in the EU27 in January and February was 1.7%. In the Czech Republic the y-o-y growth of HICP was 1.4% in January, 1.3% in February and according to preliminary results it stood at 1.7% in March. Like the aggregate index of consumer prises also HICP showed, due to the same reasons, a significant slow-down of growth, which values dropped below the EU27 average.
_________________
* goods and services whose prices are either partly or completely regulated