Services - 3. quarter of 2005
Publication Date: 18. 11. 2005
Product Code: e-9006-05
Services in the 3rd quarter of 2005
Sales in observed kinds of services were up by 3.7% y-o-y at constant prices and the seasonally adjusted sales grew by 3.4%. The number of working days was the same as in Q3 2004.
Table 1 Sales indices in services
(Corresponding period of previous year = 100, constant prices)
2004 | 2005 | ||||||||
Q1 | Q2 | Q3 | Q4 | Year | Q1 | Q2 | Q3 | Q1-Q3 | |
| Services | 103.6 | 104.7 | 102.1 | 102.7 | 103.2 | 103.1 | 102.6 | 103.7 | 103.1 |
| Retail trade total (CZ-NACE 50, 52, 55) | 101.6 | 102.8 | 101.4 | 103.7 | 102.4 | 103.1 | 103.7 | 103.4 | 103.4 |
| Transport, post and telecommunications (CZ-NACE 60-64) | 107.8 | 110.1 | 104.9 | 102.7 | 106.2 | 102.8 | 100.9 | 102.7 | 102.1 |
| Selected market services (CZ-NACE 72, 74, 93) | 105.4 | 104.5 | 100.3 | 99.8 | 102.2 | 103.4 | 100.8 | 106.2 | 103.4 |
Not seasonally adjusted sales in retail trade total rose by 3.4%, in transport, post and telecommunications by 2.7%. The highest growth was recorded in selected market services, where the sales grew by 6.2%.
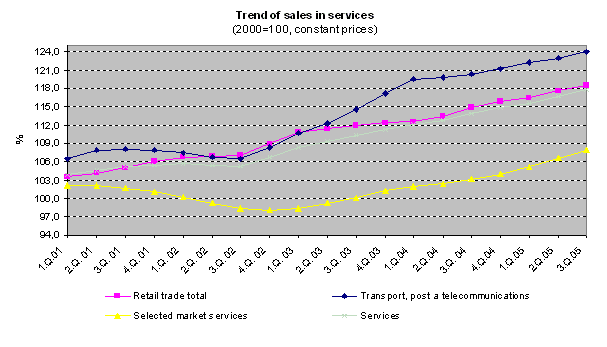
Table 2 Retail sales indices
(Corresponding period of previous year = 100, constant prices)
2004 | 2005 | ||||||||
Q1 | Q2 | Q3 | Q4 | Year | Q1 | Q2 | Q3 | Q1-Q3 | |
| Retail trade incl. automotive segment (CZ-NACE 50, 52) | 101.0 | 102.7 | 101.9 | 104.1 | 102.5 | 103.9 | 104.7 | 103.9 | 104.2 |
| Automotive segment (CZ-NACE 50) | 97.3 | 101.4 | 100.8 | 105.7 | 101.5 | 105.5 | 108.0 | 103.6 | 105.7 |
| Retail trade (CZ-NACE 52) | 102.8 | 103.4 | 102.3 | 103.4 | 103.0 | 103.2 | 103.1 | 104.0 | 103.4 |
| Hotels and restaurants (CZ-NACE 55) | 108.7 | 104.1 | 96.0 | 98.0 | 101.4 | 94.2 | 92.6 | 97.9 | 94.8 |
The retail sales grew more than in the previous seven quarters (+4.0%). The sales of food were roughly the same as the average of last 12 months, the growth was 2.8%, of which 2.7% in non-specialised stores with food, beverages or tobacco predominating, which are more important in terms of weights, and 3.5% in specialised stores. The development of the retail sales was mainly given by the sale of non-food goods (+4.9%), which was by 1.3 percentage points higher than the average of the last 12 months period. This was the highest figure since Q3 2003. Despite the lower September growth of the sale of textile, clothing and footwear in specialised stores, the growth in the whole quarter in these CZ-NACE activities was higher (+9.5%) than in the other observed activities. The sellers of electronics, furniture and goods for households continued prospering (increase in sales by 5.8%). The other retail sales in specialised stores increased too (+2.7%). The sales of cosmetic and toilet articles, pharmaceutical and medical goods grew by 4.8%, which represented deceleration in growth by 4.5 percentage points when compared to the previous quarter.
Sales in the automotive segment grew by 3.6%, which was by 2.1 percentage points less than the average of last twelve months. The sale, maintenance and repair of motor vehicles increased by 2.5%, the highest increase being recorded in August (+5.6%). According to the statistics of the Automotive Industry Association, first registrations of vehicles were up by 3.6% in Q3 2005, in spite of the fact that the increase compared to the last year was recorded only in the category of small utility cars. The growth of sale of automotive fuel (+5.2%) corresponded to the average of last 12 months.
The decrease in sales in hotels and restaurants took place in all three months. The sales were down by 2.1% in the whole Q3 2005. A similar development was recorded in both CZ-NACE activities. Sales in restaurants, bars and canteens have been falling since the VAT Act was amended in May 2004 in all months, in Q3 2005 by 2.4%. The fall in hotels was by 1.3%; an increase was recorded only in July.
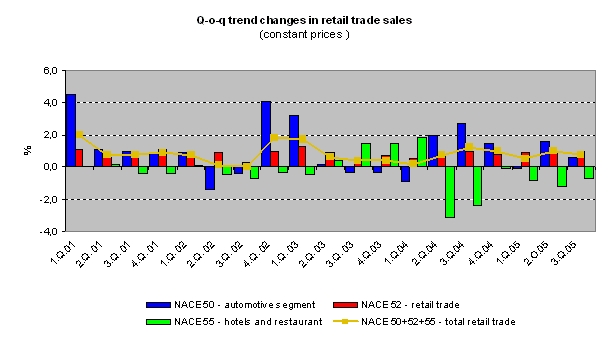
Table 3 Sales indices in transport, post and telecommunications
(Corresponding period of previous year = 100, constant prices
2004 | 2005 | ||||||||
Q1 | Q2 | Q3 | Q4 | Year | Q1 | Q2 | Q3 | Q1-Q3 | |
| Transport (CZ-NACE 60-63) | 109.0 | 113.2 | 106.0 | 102.7 | 107.5 | 100.4 | 97.4 | 99.8 | 99.1 |
| Land transport; transport via pipelines (CZ-NACE 60) | 104.6 | 109.5 | 102.6 | 103.7 | 105.0 | 102.3 | 99.8 | 102.3 | 101.4 |
| Water transport (CZ-NACE 61) | 88.8 | 99.8 | 157.6 | 156.0 | 119.4 | 153.5 | 142.2 | 167.1 | 154.0 |
| Air transport (CZ-NACE 62) | 120.1 | 128.1 | 106.4 | 106.4 | 113.7 | 104.1 | 104.1 | 104.5 | 104.3 |
| Supporting and auxiliary transport activities; activities of travel agencies (CZ-NACE 63) | 114.4 | 116.4 | 110.1 | 100.7 | 110.0 | 97.0 | 92.9 | 95.4 | 95.0 |
| Post and telecommunications (CZ-NACE 64) | 105.6 | 103.4 | 102.3 | 102.6 | 103.4 | 107.7 | 109.3 | 109.7 | 108.9 |
Sales in transport were down by 0.2% y-o-y in Q3 2005. The decrease of sales in transport via railways by 3.4% was only a confirmation of the long-term trend, which is observed especially in freight transport, whose outputs dropped by 1.4% in Q3 2005. Freight transport has an approximately 80% share in the total sale in transport via railways. The outputs in the passenger transport, which is less important in terms of volume, continued in their tendency from Q2 2005 and increased by 2.1%. Especially enterprises with 20 or more employees prospered in road transport (+3.8%). They better coped with the new requirements of the market after the entry of the Czech Republic into the EU. The increase in water transport (+67.1%) was also influenced by the sale of automotive fuel, which some enterprises sell as their auxiliary activity. High growth of sales in scheduled air transport was partly eliminated by the decrease in non-scheduled air transport. In supporting and auxiliary transport activities there are some important enterprises, which apart from their principal transport activity are also engaged in the selling of goods whose extremely high fall was reflected in the drop of total sales.
Sales in post and telecommunications increased due to the development in telecommunications, which grew considerably (+11.1%) like in the first half a year. Sale of the postal services dropped by 3.1%.
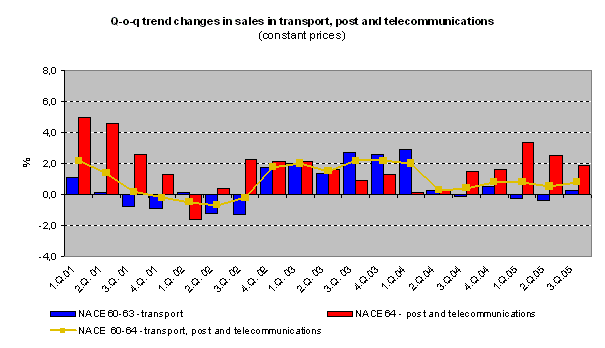
Table 4 Sales indices in selected market services
(Corresponding period of previous year = 100, constant prices)
2004 | 2005 | ||||||||
Q1 | Q2 | Q3 | Q4 | Year | Q1 | Q2 | Q3 | Q1-Q3 | |
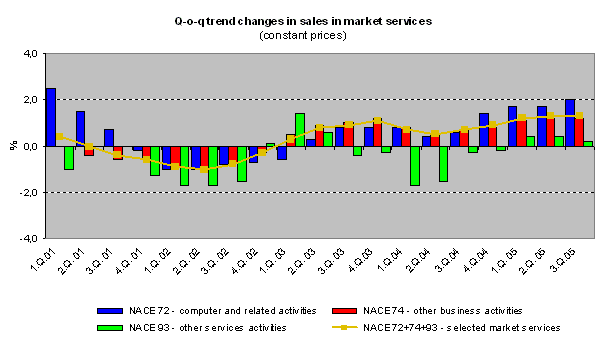
| Computer and related activities (CZ-NACE 72) | 102.9 | 111.5 | 98.1 | 91.0 | 99.0 | 111.5 | 97.2 | 107.8 | 104.9 |
| Other business activities (CZ-NACE 74) | 106.3 | 103.3 | 100.9 | 102.5 | 103.1 | 101.8 | 101.6 | 106.0 | 103.1 |
| Other service activities (CZ-NACE 93) | 97.3 | 95.6 | 95.8 | 95.0 | 95.9 | 99.1 | 101.6 | 102.1 | 100.9 |
Sales in computer and related activities rose by 7.8% in Q3 2005. The driving force of this increase was the development in the most significant CZ-NACE activity in terms of volume - software consultancy and supply, where the increase reached the two-digit level (index 110.4). Even the sales of maintenance and repair of office machinery were not behind, they increased by 7.3 %. Thus the long-term decrease, which continued since the beginning of the year 2004, stopped. On the other hand the long-term decline of sales of database activities continued (-9.1%).
The growth of other business activities when compared to the first half of 2005 accelerated rapidly to 6.0%. The highest increase in sales was in architectural and engineering activities and related technical consultancy (+9.0%), which completely changed the situation from the first half of the year, where sales fell by 11.9%. High increases were also recorded in l egal, accounting, bookkeeping and auditing activities and tax consultancy and advertising (+4.4% and +5.0%, respectively). Very similar development occurred in miscellaneous business activities and industrial cleaning (index 106.1 and 106.0, respectively). Since the beginning of the year, there has been a marked slowdown in the growth of sales in labour recruitment and provision of personnel (where a two digit growth was reported the whole last year).
The growth in other service activities (predominantly of personal nature), which began in Q2 2005, continued (+2.1%). The sales in washing and dry-cleaning of textile and fur products grew more (+3.8%).
CZ-NACE 50, 52, 55 – Retail trade total
CZ-NACE 50, 52 – Retail trade incl. automotive segment
CZ-NACE 50 – Automotive segment
CZ-NACE 52 – Retail trade
CZ-NACE 60, 61, 62, 63, 64 – Transport, post and telecommunications
CZ-NACE 72, 74, 93 – Selected market services