Producer price indices - 2. quarter of 2007
Product Code: e-7032-07
Producer price indices in Q2 2007
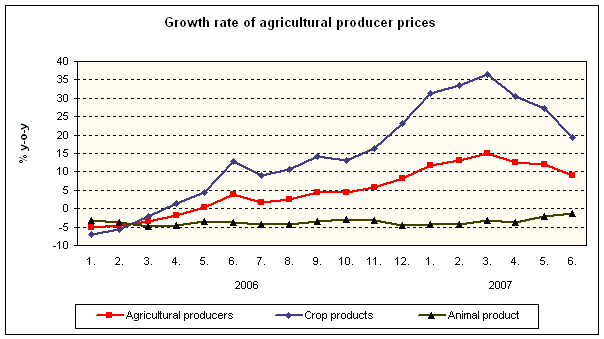
The prices of agricultural products in Q2 2007 compared to Q1 2007 increased by 0.4 %. Prices of crop products increased by 0.3 %, prices of animal products by 0.5%. The prices of potatoes grew by 5.8 % and fruit by 3.3 %. During the observed period prices of vegetables dropped by 10.1 %. The prices of pigs for slaughter grew by 2.2% (a drop of 3.8% in Q1) and prices of poultry by 1.4%. Prices of eggs fell by 2.8 %, cattle for slaughter by 0.3% and milk by 0.1%.
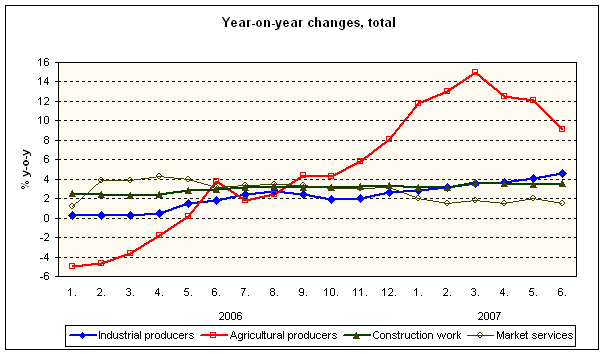
The prices for agricultural products were by 10.9% up in Q2 2007 y-o-y (in Q1 by 13.3 %). The growth was influenced by the prices of crop products, which increased by 24.9 % while the prices of animal products were down by 2.4 %. The increase of prices for crop products owed mainly to higher prices of potatoes by 33.0 % and cereals by 37.1 %. The prices of vegetables were lower by 17.2% and fruit by 6.5 %. The fall of prices for animal products was attributed especially to the fall of prices of pigs for slaughter by 9.0 %. The prices of cattle for slaughter dropped by 2.3% and milk declined by 1.9%. The prices of eggs and poultry were up by 2.4 % and 6.7%, respectively.
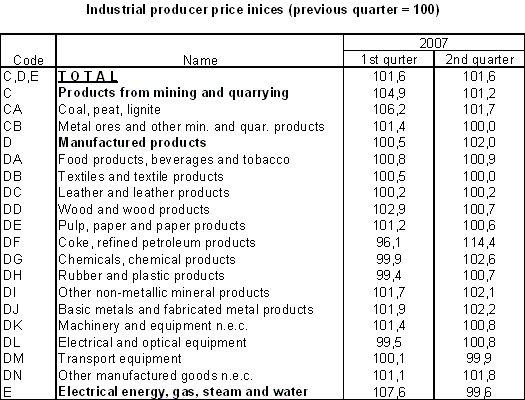
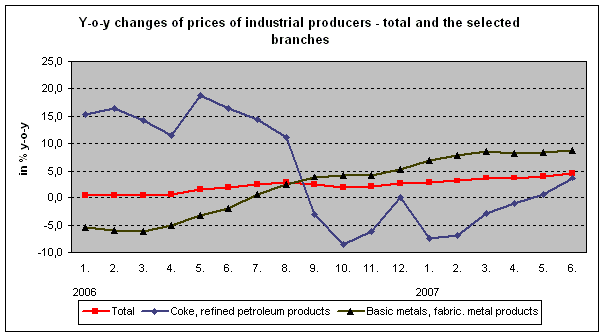
In Q2 2007 compared to Q1 2007 the prices of industrial producers increased by 1.6 %. The growth of the price level was significantly affected by particularly the growth of prices for ‘ coke, refined petroleum products’. Prices in this branch increased by 14.4% quarter-on-quarter. While Q1 was influenced by a price drop in January, Q2 was characterised by the growth of prices (prices of refined petroleum products). Another significant factor, influencing the growth of the overall price index, was the increase of prices of ‘ basic metals and fabricated metal products’ by 2.2%. Prices in this branch have been growing already for 17 months and affected the price level in both Q2 and Q1 2007. The development of the price index was also affected by the price growth in the food sector by 0.9%. In Q2 as against Q1 prices of meat and meat products, dairy products and ice cream and pastry goods recorded a growing tendency.
Prices dropped in Q2 only minimally, for ‘ electrical energy, gas, steam and hot water’ by 0.4% and for ‘transport equipment’ by 0.1%.
The average monthly rate of price growth in Q2 was 0.6 % (Q1 2007 it was 0.7%) of which the most considerable growth rate (4.6%) showed the prices for ‘coke, refined petroleum products’.

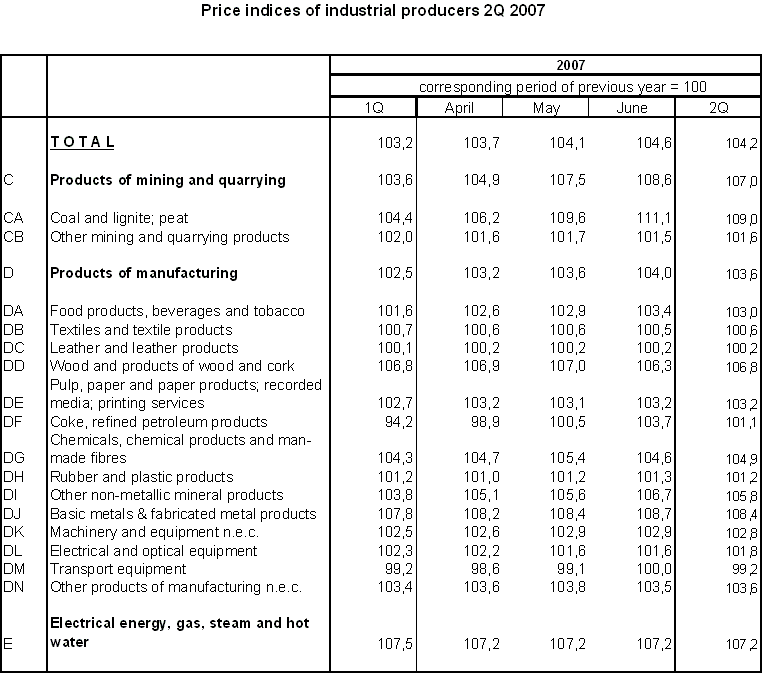
Year-on-year industrial producers prices increased by 4.2% in Q2 2007 compared to Q2 2006 (by 3.2% in Q1). The price level was significantly influenced by the growth of prices for ‘ basic metals and fabricated metal products’ by 8.4% of which the most for cast iron and steel tubes (+18.7%) and basic iron, steel and ferroy-alloys (+12.8%). Another factor that significantly affected the overall price index was the growth of prices for ‘electrical energy, gas, steam and hot water’. Prices increased by 7.2%, of which the most for electricity production and distribution (+9.1%). Among the branches that also affected the growth of the overall index for the whole industry with its price growth belonged other non-metallic mineral products (+5.8%). The biggest growth occurred in bricks and tiles (19.2%) and glass and glass products (10.3%). Prices of bricks and tiles have been increasing year-on-year since December 2005; the y-o-y growth in Q2 2007 of 19.2% is the highest since Q2 1998. Another increasing factor were prices of ‘food products, beverages and tobacco‘ (+3.0%). The biggest price growth occurred for ‘grain mill products, starches and starch products’ (+14.6%) and ‘fresh pastry goods and cakes’ (13.1%) which is an opposite trend in both groups compared to Q2 2006 (-0.9%, -6.6% respectively).
The drop of prices in Q2 occurred only in ‘transport equipment’ (-0.8%). Prices in this branch have been dropping year-on-year since Q3 2004. The biggest contribution to this drop had ‘motor vehicles’ (-1.9%) and ‘parts and accessories for motor vehicles’ (-1.4%).
The prices of construction work in Q2 2007 compared to Q1 2007 rose by 0.3 % and the construction material input prices by 0.7 %.
The prices of construction work in Q2 2007 compared to Q2 2006 were y-o-y higher by 3.6 % (similarly as in Q1), the construction material input prices increased by 6.7 % (in Q1 2007 by 4.2 %).
The prices of market services in Q2 2007 compared to Q1 2007 rose by 0.1 %. The prices of real estate, renting and business services grew by 0.1 % (the price increase for services in real estate (+ 0.2 %) and advertising services (+ 0.3 %).
The prices for market services in Q2 2007 compared to Q2 2006 increased y-o-y by 1.7 % in total (in Q1 2007 by 1.8 %). The overall price level development was strongly affected by the prices of real estate renting and business services which advanced by 2.5%. In this area the highest increase showed especially in prices for advertising services (+ 5.8%) and computer and related activities (+2.9%). The prices for freight transport and storage were 2.6 % up. The increase of 4.6% was recorded in prices for road freight transport. The prices for insurance and pension funding services were 2.6 % down. Especially the prices for motorcar insurance dropped by 3.6 %.
