Construction - 4. quarter of 2006
Publication Date: 12. 02. 2007
Product Code: e-8216-06
Construction in the year 2006
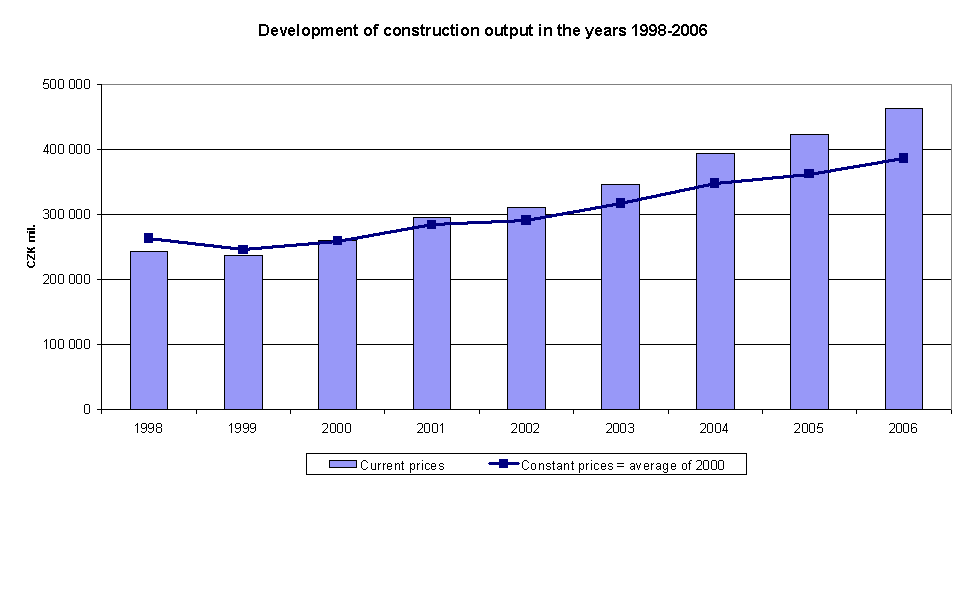
The growth of total construction output continued in 2006, being 6.6% at constant prices. The rate was faster than in 2005 (when total construction output increased by 4.2% at constant prices) and varied between individual quarters of the year (0.5% in Q1 2006, 6.2% in Q2 2006, 7.4% in Q3 2006 and 9.5% in Q4 2006). The variances were strongly affected by weather conditions (which were unfavourable in Q1 2006 and favourable in Q4 2006).
The main factors of growth of construction output remained:
- Growth of building construction output where intensive construction of multi-dwelling buildings and family houses continued, boosted by dynamic development in the mortgage market and saving-in-building-society loans and by financial support for young married couples. The growth of output was also affected by the implementation of foreign investors’ developer projects focused especially on construction of multifunctional and office centres.
- Growth of civil engineering output was enhanced by construction of highways and reconstruction and modernisation of railways incl. railway junctions.
Structure of construction output
Output for investment, i.e. long life goods, was the basic feature of the market structure of construction (making up nearly three-quarters of the total).
New construction including reconstruction and modernisation made up a decisive part of the construction output, its structure being as follows:
- residential buildings 18.7 % (multi-dwelling buildings and family houses and extensions thereto)
- non-residential buildings designed for production 17.0 % (factory halls, non-residential farm buildings, wholesale and retail trade buildings, traffic buildings)
- non-residential buildings not designed for production 21.6 % (shopping centres, school buildings, hospital or institutional care buildings, office buildings)
- civil engineering works 41.2 % (highways, streets and roads, bridges, tunnels)
- water management works 1.5 % (dams, weirs, reservoirs on watercourses, locks)
In the European context, the structure of construction output in the Czech Republic showed the following differences:
- lower (but gradually increasing) percentage of housing construction
- lower percentage of repair and maintenance
- high percentage of civil engineering works
Construction output volume
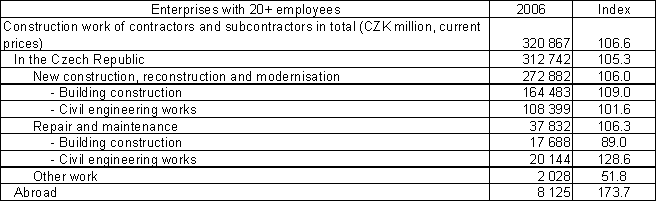
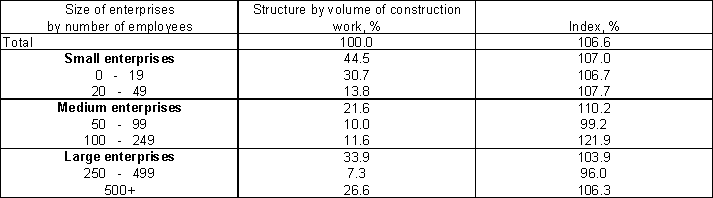
Construction work valued at CZK 463 060 million was done in 2006. The decisive basis of construction enterprises was 2 482 enterprises with 20+ employees which carried out construction work worth CZK 320 867 million, i.e. by 6.6% more than in 2005.
- Index is constant price index.
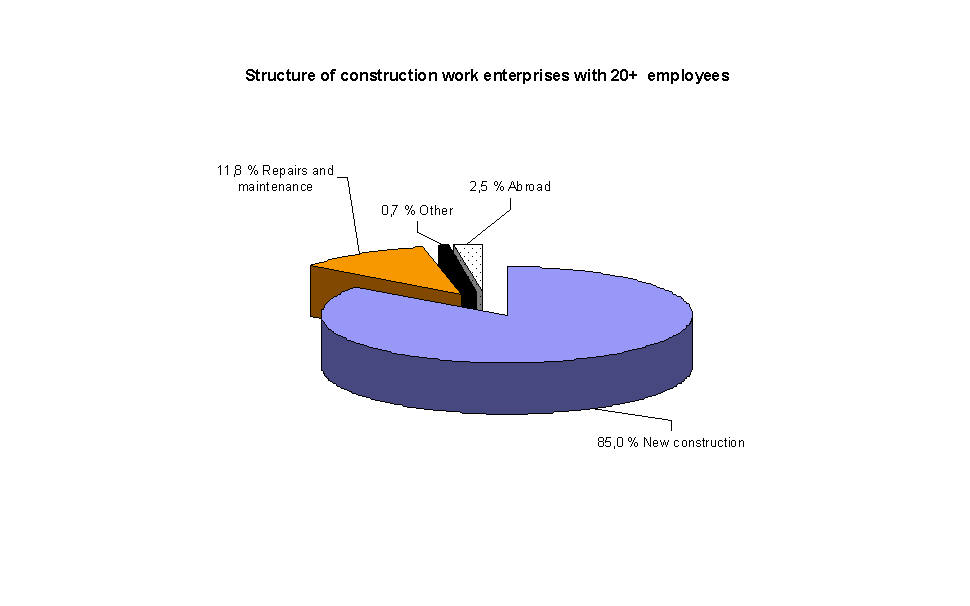
Growth and the structure of construction work in 2006: by size of enterprises
Employment, wages and labour productivity
Employment in construction enterprises with 20+ employees grew by 0.3% year-on-year. In 2006 the average number of employees was 162.2 thousand, of which 103.7 thousand were manually working persons (-2.0%). Enterprises with 20+ employees recorded fewer manually working persons and more white-collar employees. This was related to the fact that, besides construction activity, construction enterprises markedly expanded their property developing and real estate activities. The average monthly wage of employees in construction enterprises with 20+ employees reached CZK 20 304 (+7.3%), that of manually working persons CZK 16 332 (+6.7%). Labour productivity measured as volume of construction work per employee grew by 6.3% year-on-year in enterprises with 20+ employees.
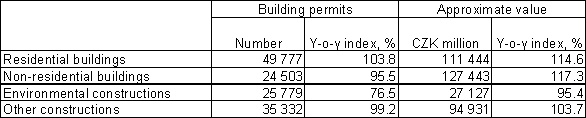
Building permits and approximate value of constructions
The planning and building control authorities granted 135 391 building permits in 2006, which was by 5.3% less year-on-year: 25 349 permits in Q1 2006 (-7.1%), 34 360 permits in Q2 2006 (-8.6%), 38 727 permits in Q3 2006 (-5.7%), and 36 955 permits in Q4 2006 (-0.1%). The number of building permits granted grew only in October 2006 (+3.6%), following 21 consecutive months of decrease; in spite of that, a fall was registered in Q4 2006.
The approximate value of newly permitted constructions reached CZK 360.9 billion, which was by 10.8% more than in 2005: CZK 89.1 billion in Q1 2006 (-10.9%), CZK 101.3 billion in Q2 2006 (+19.9%), CZK 100.3 billion in Q3 2006 (+9.6%), and CZK 94.4 billion in Q4 2006 (+22.7%). Only December 2006 saw year-on-year increase in approximate value of building permits both for new constructions (+50.7%) and for renewals and enhancements (+45.5%) in all types of constructions (residential buildings, non-residential buildings, environmental constructions and other constructions).
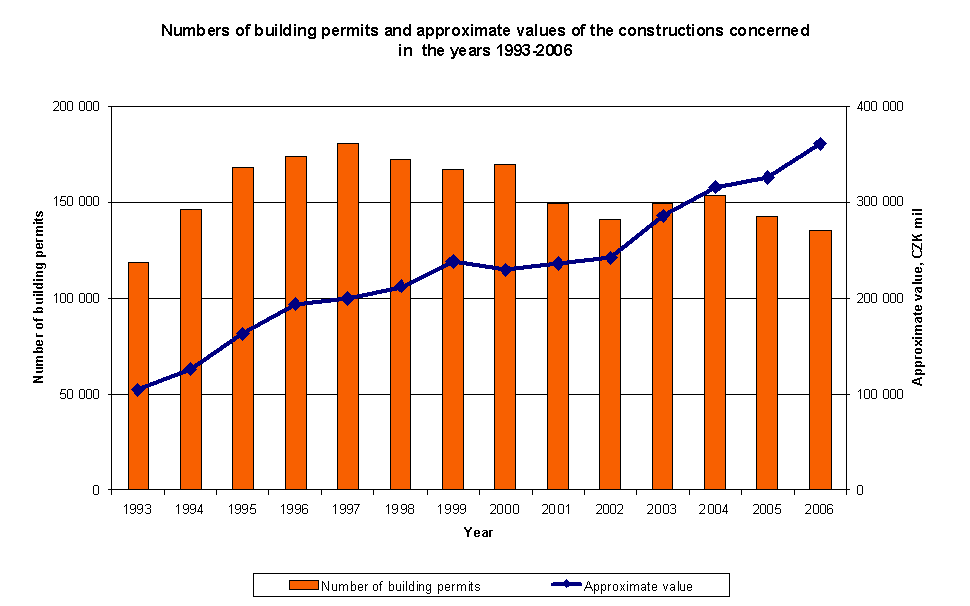
The above graph shows that approximate value per building permit has been growing since 2005. The reason is financially demanding construction works, especially in transport infrastructure and multifunctional centres. In 2006 26 constructions with approximate value over CZK 1 billion were permitted.
Building permits in 2006: growth, structure and approximate value