Analysis of the housing construction in the Czech Republic - in 2006
Publication Date: 15. 05. 2007
Product Code: e-8215-07
Analysis of housing construction in 2006
1. Summary
Starting and completing of dwellings
- in 2006, 30 190 dwellings were completed (down by 8.1%);
- 43 747 dwellings were started, i.e. the most since 1993;
- higher number of dwellings started than that of completed resulted in an increase of dwellings under construction – 168 825 dwellings were under construction at the end of 2006.
Acquisition value
- the acquisition value of residential buildings completed in 2006 reached CZK 61.8 billion;
- acquisition value per dwelling was CZK 2 069 thous. (2006/2005 index is 107.5%);
- acquisition value per m2 of living floor space was CZK 28.8 thous. (up by 5.3%).
Amenities
- electricity and water supply coverage is considered 100% and is not observed;
- over 90% of dwellings completed in 2006 were connected to a central heating system (local or long-distance heating);
- the percentage of dwellings connected to the gas service grew in all types of housing construction;
- more than half of the new family houses were connected to the sewerage system (65.6%).
Length of construction period
- the average construction period of a residential building dropped by 13.6% year-on-year and took 41.6 months;
- compared to multi-dwelling buildings, construction period for family houses and extensions thereto was markedly longer; approx. 20% of family houses was being built more than 5 years.
Size of dwellings
- average living floor space per dwelling grew by 2.1% on 2005 and reached 71.8 m2;
- average useful floor space per dwelling was 102.1 m2 (up by 1.4%);
- both living and useful floor space kept on growing; the size of useful floor space of dwellings in family houses was more than double of that in multi-dwelling buildings.
Number of rooms per dwelling
- bed-sitters made up 5.8% of the total number of dwellings; dwellings with a kitchen plus 1 room 12.8%, 2 rooms 20.1%, 3 rooms 20.8%, 4 rooms 20.9%, and 5 or more rooms 19.6%;
- family houses - prevailing were dwellings 5+1 (5 rooms plus a kitchen);
- multi-dwelling buildings - prevailing were dwellings 2+1 (2 rooms plus a kitchen).
Construction material of load-bearing walls
- masonry prevailed (family houses over 90%, multi-dwelling buildings over 75%);
- decrease of prefabricated constructions (of multi-dwelling buildings in particular - from 22.5% in 1997 to 4.7% in 2006,);
- continuing low percentage of wood constructions (approx. 3.5%).
Building sites for family houses
- the average size of a building site kept on growing (from 887.6 m2 in 1997 to 1 080 m2 in 2006);
- larger building sites were in small municipalities below 5 000 population (average size up to 1 200 m2);
- the average built-up area was 136.3 m2.
Territorial allocation of dwellings
- the process of sub-urbanisation, i.e. trend of residential units being built in the neighbourhood of cities (Prague, Plzeň, České Budějovice, Brno, Liberec), continued;
- intensive construction of dwellings in winter holiday centres (Harrachov, Špindlerův Mlýn, Železná Ruda) continued.
2. Numbers and the structure dwellings
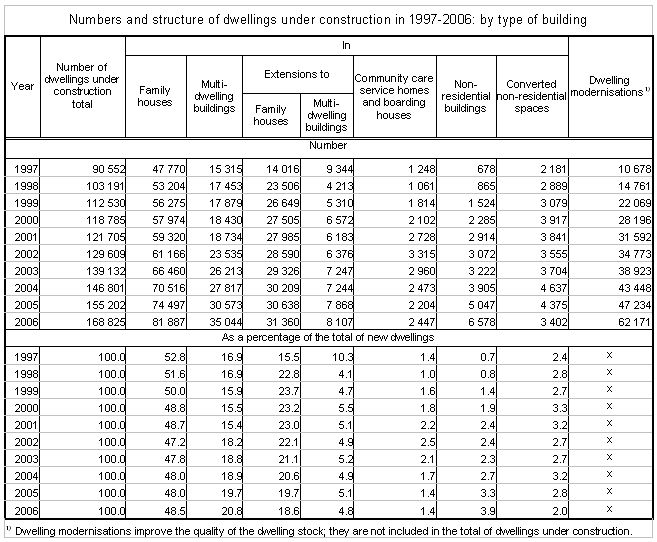
In 2006 30 190 dwellings were completed, which was down by 8.1% year-on-year. Decreases in dwellings completed were recorded in all categories of housing construction except dwellings in extensions to multi-dwelling buildings where a 12.8% growth occurred.
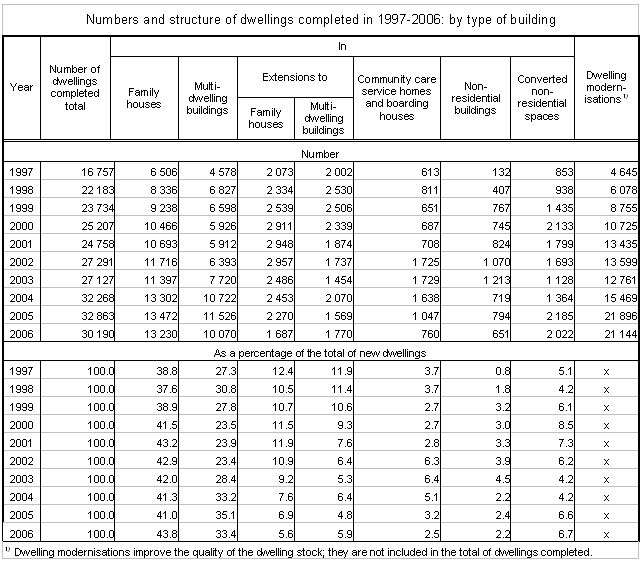
In 2006 the percentage of dwellings completed in family houses increased and that of multi-dwelling buildings slightly dropped. The percentages of the other categories of dwellings completed were lower.
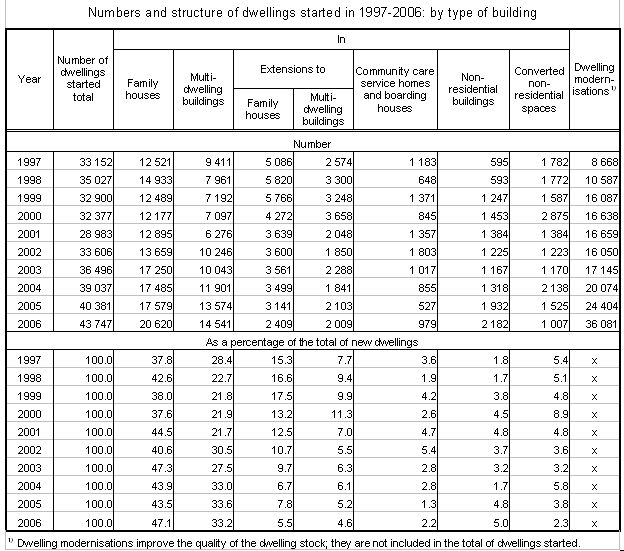
According to the dwellings started figures, housing construction continued picking up, following a sharp fall at the start of the 1990’s and fall in 2001. This trend was noticeable also in 2006 when 43 747 dwellings were started, the highest number since 1993.
In 2006 14 541 dwellings started in new multi-dwelling buildings made up 33.2% of the total of all dwellings started. The percentage of new family houses was around 40% over last years. In 2006 it reached 47.1%, which was up by 3.6 percentage points on 2005. The proportion of dwellings started as extensions to family houses had a decreasing tendency in last three years, being as low as 5.5% in 2006. The number of dwellings started as extensions to multi-dwelling buildings slightly dropped against 2005 and its percentage was 4.6%. A decreased share in dwellings started was observed also for dwellings in converted non-residential spaces.
Dwellings under construction are the only section of housing construction that has been steadily increasing since it reached the minimum in 1994. In 2006 there were 168 825 dwellings under construction in the Czech Republic, including those whose construction was suspended; this resulted in 16.7 dwellings under construction per 1 000 population.
Out of the total number of 168 825 dwellings under construction at the end of 2006, dwellings in new family houses had the highest percentage (48.5%), followed by dwellings in extensions to family houses (18.6%). Due to a considerably shorter construction period of multi-dwelling buildings, the percentage of dwellings in them was substantially lower, namely 20.8% in new multi-dwelling buildings and 4.8% in extensions to multi-dwelling buildings. The remaining percentage of dwellings under construction was made up of the other types of buildings in which new dwellings were being constructed.
3. Types of dwellings
The size of living and useful floor space of dwellings varied during the years, depending on the structure of completed buildings. In 2006 the average living floor space per dwelling was 71.8 m2 and the average useful floor space 102.1 m2.
In construction of family houses, living floor space per dwelling is nearly double that in multi-dwelling buildings (97.9 m2 and 50.2 m2 respectively). The smallest dwellings are built in community care service homes and boarding houses (28.3 m2).
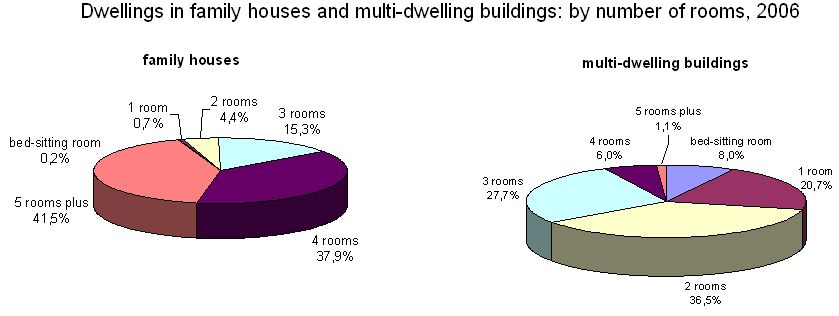
Size of dwellings completed differs depending on the type of a building. Prevailing size in family houses are dwellings 5+1 (5 rooms plus a kitchen), while in multi-dwelling buildings 2-room dwellings. The number of rooms per dwelling slightly increases.
Amenities of dwellings are better year by year. Electricity and water supply coverage is considered 100% and is not observed. In all types of housing construction the percentage of dwellings connected to the gas service increased. In 2006 30.5% dwellings were completed without connection to the gas service. More than half of new family houses were connected to the sewerage system (65.6%); 9.8% of family houses had a wastewater treatment plant of their own. In a large majority of family houses central heating was put in (90.7% local heating, 0.5% long-distance heating). Among multi-dwelling buildings 43.0% had local central heating and 40.8% long-distance central heating.
As for the use of construction materials, masonry prevailed – 92.0% of dwellings were built of bricks and blocks. The percentage for family houses was 92.6% and for multi-dwelling buildings 77.7%. Prefabricated constructions dropped considerably, in particular of multi-dwelling buildings (from 22.5% in 1997 to 4.7% in 2006). A low percentage of wood constructions continued, being 3.6% for family houses and a mere 1.0% for multi-dwelling buildings.
The size of building sites for family houses constantly grew over the years. The average size of a building site increased from 887.6 m2 in 1997 to 1 080 m2 in 2006. Larger building sites are in small municipalities with population below 5 000 (average size up to 1 200 m2). The size of built-up area is stagnating evenly across size groups of municipalities and regions. The average built-up area per family house is around 140 - 150 m2; in 2006 it was 136.3 m2.
Construction period was still too long, although it has been slightly decreasing in last years. In 2006 construction of a family house took 3.3 years on average. Nearly 20% of family houses are being built over 5 years. Multi-dwelling buildings were completed by more than 6 months faster in comparison to family houses (2.6 years). Dwellings in extensions to family houses take the longest construction time (over 5 years) .
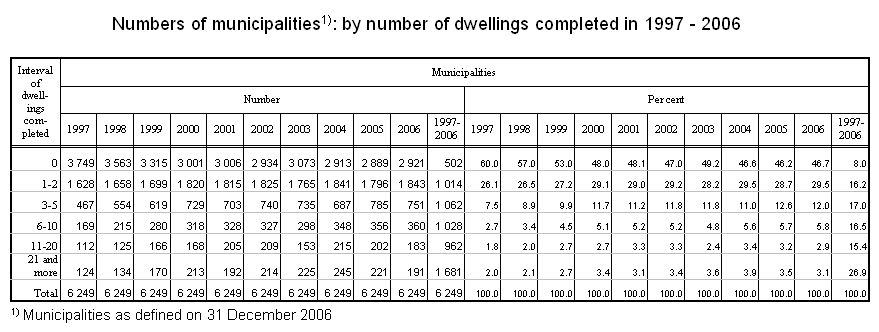
4. Housing construction by region and municipality
In 2006 most dwellings were built in Prague and its neighbourhoods, in the Středočeský and Jihomoravský regions, fewest in the Liberecký and Karlovarský regions. The trend of sub-urbanisation, i.e. construction of residential units becoming more and more oriented to the neighbourhood of cities, which was started in the second half of the 1990’s, continued. Conversely, the industrial regions in north and northwest Bohemia report the lowest housing construction intensity figures.
Municipalities 1) with the highest number of dwellings completed in 1997 - 2006
Municipality | Dwellings completed | Municipality | Dwellings completed | Municipality | Dwellings completed | |||
No. | Per 1 000 popul. 2) | No. | Per 1 000 popul. 2) | No. | Per 1 000 popul. 2) | |||
| Praha | 41 948 | 3.62 | Říčany (o.Praha-východ) | 428 | 3.85 | Nové Město nad Metují (o.Náchod) | 255 | 2.51 |
| Brno | 10 941 | 2.91 | Průhonice (o.Praha-západ) | 426 | 21.77 | Troubky (o.Přerov) | 254 | 12.73 |
| Plzeň | 3 147 | 1.89 | Bílovice n/Svitavou (o.Brno-venkov) | 406 | 17.11 | Starý Plzenec (o.Plzeň-jih) | 249 | 5.79 |
| Ostrava | 2 883 | 0.91 | Špindlerův Mlýn (o.Trutnov) | 400 | 30.41 | Světlá nad Sázavou (o.Havl.Brod) | 249 | 3.49 |
| Liberec | 2 764 | 2.80 | Ústí nad Orlicí | 389 | 2.58 | Krnov (o.Bruntál) | 249 | 0.97 |
| Olomouc | 2 575 | 2.52 | Turnov (o.Semily) | 386 | 2.65 | Květnice (o.Praha-východ) | 247 | 125.13 |
| České Budějovice | 2 468 | 2.54 | Tišnov (o.Brno-venkov) | 386 | 4.63 | Planá nad Lužnicí (o.Tábor) | 246 | 7.95 |
| Jihlava | 2 127 | 4.18 | Tachov | 383 | 3.02 | Vejprnice (o.Plzeň-sever) | 246 | 9.61 |
| Pardubice | 2 101 | 2.32 | Písek | 379 | 1.27 | Vrchlabí (o.Trutnov) | 244 | 1.85 |
| Hradec Králové | 2 016 | 2.08 | Most | 371 | 0.54 | Bystřice (o.Benešov) | 243 | 6.19 |
| Zlín | 1 494 | 1.86 | Pelhřimov | 369 | 2.21 | Frenštát pod Radhoštěm (o.Nový Jičín) | 243 | 2.13 |
| Hostivice (o.Praha-západ) | 1 381 | 29.09 | Kutná Hora | 366 | 1.71 | Mohelnice (o.Šumperk) | 241 | 2.45 |
| Prostějov | 1 329 | 2.83 | Dobřany (o.Plzeň-jih) | 364 | 6.34 | Úpice (o.Trutnov) | 240 | 4.02 |
| Mladá Boleslav | 1 300 | 2.97 | Mělník | 355 | 1.83 | Sokolov | 239 | 0.95 |
| Jesenice (o.Praha-západ) | 1 212 | 43.12 | Hlučín (o.Opava) | 355 | 2.47 | Chrastava (o.Liberec) | 239 | 4.00 |
| Karlovy Vary | 1 204 | 2.27 | Černošice (o.Praha-západ) | 350 | 7.32 | Čeladná (o.Frýdek-Místek) | 237 | 11.36 |
| Znojmo | 988 | 2.77 | Prachatice | 349 | 2.96 | Polná (o.Jihlava) | 236 | 4.78 |
| Uherské Hradiště | 916 | 3.42 | Břeclav | 347 | 1.38 | Velká Bíteš (o.Žďár n.Sáz.) | 236 | 4.85 |
| Kuřim (o.Brno-venkov) | 843 | 9.17 | Hranice (o.Přerov) | 342 | 1.73 | Troubsko (o.Brno-venkov) | 236 | 13.97 |
| Kroměříž | 819 | 2.80 | Kdyně (o.Domažlice) | 335 | 6.79 | Úvaly (o.Praha-východ) | 235 | 4.94 |
| Tábor | 818 | 2.24 | Vsetín | 325 | 1.12 | Blatná (o.Strakonice) | 235 | 3.49 |
| Třebíč | 792 | 2.02 | Přeštice (o.Plzeň-jih) | 324 | 5.05 | Rokytnice nad Jizerou (o.Semily) | 235 | 7.01 |
| Benešov | 752 | 4.65 | Frýdek-Místek | 321 | 0.53 | Šlapanice (o.Brno-venkov) | 235 | 3.70 |
| Opava | 747 | 1.23 | Psáry (o.Praha-západ) | 320 | 16.40 | Moravské Budějovice (o.Třebíč) | 232 | 2.89 |
| Milovice (o.Nymburk) | 745 | 16.38 | Litovel (o.Olomouc) | 317 | 3.14 | Boskovice (o.Blansko) | 231 | 2.04 |
| Roztoky (o.Praha-západ) | 732 | 12.41 | Dolní Třebonín (o.Č.Krumlov) | 315 | 41.58 | Bystřice (o.Frýdek-Místek) | 230 | 4.55 |
| Jablonec nad Nisou | 729 | 1.61 | Kamenice (o.Praha-východ) | 313 | 10.95 | Dobřichovice (o.Praha-západ) | 229 | 8.09 |
| Bruntál | 686 | 3.88 | Rokycany | 312 | 2.20 | Kopřivnice (o.Nový Jičín) | 229 | 0.96 |
| Valašské Meziříčí (o.Vsetín) | 683 | 2.47 | Zdiby (o.Praha-východ) | 310 | 26.06 | Kosmonosy (o.Ml.Boleslav) | 227 | 5.99 |
| Blansko | 669 | 3.26 | Aš (o.Cheb) | 306 | 2.44 | Stod (o.Plzeň-jih) | 227 | 6.40 |
| Havlíčkův Brod | 665 | 2.72 | Český Těšín (o.Karviná) | 304 | 1.15 | Frýdlant nad Ostravicí (o.Frýdek-Místek) | 227 | 2.32 |
| Kolín | 639 | 2.11 | Karviná | 304 | 0.47 | Luhačovice (o.Zlín) | 225 | 4.02 |
| Brandýs n/Labem-Stará Boleslav (o.Praha) | 637 | 4.13 | Hovorčovice (o.Praha-východ) | 303 | 27.19 | Litoměřice | 224 | 0.90 |
| Beroun | 615 | 3.49 | Staré Město (o.Uher.Hradiště) | 302 | 4.47 | Újezd u Brna (o.Brno-venkov) | 224 | 7.91 |
| Přerov | 615 | 1.28 | Kralupy nad Vltavou (o.Mělník) | 299 | 1.71 | Mikulov (o.Břeclav) | 224 | 2.92 |
| Odolena Voda (o.Praha-východ) | 599 | 13.23 | Mariánské Lázně (o.Cheb) | 298 | 2.04 | Stochov (o.Kladno) | 223 | 4.10 |
| Třinec (o.Frýdek-Místek) | 592 | 1.52 | Roudnice nad Labem (o.Litoměřice) | 298 | 2.27 | Hluboká nad Vltavou (o.Č.Budějovice) | 222 | 4.86 |
| Kladno | 583 | 0.83 | Nepomuk (o.Plzeň-jih) | 292 | 8.22 | Stříbro (o.Tachov) | 222 | 2.88 |
| Třeboň (o.Jindř.Hradec) | 581 | 6.43 | Sezemice (o.Pardubice) | 291 | 9.59 | Žďár nad Sázavou | 222 | 0.92 |
| Ústí nad Labem | 577 | 0.61 | Sušice (o.Klatovy) | 285 | 2.46 | Tlučná (o.Plzeň-sever) | 220 | 9.17 |
| Otrokovice (o.Zlín) | 576 | 2.99 | Hodonín | 284 | 1.05 | Rychnov u Jablonce nad Nisou (o.Jablonec | 220 | 10.61 |
| Rudná (o.Praha-západ) | 554 | 17.27 | Velké Přílepy (o.Praha-západ) | 283 | 26.94 | Červený Kostelec (o.Náchod) | 220 | 2.61 |
| Vyškov | 535 | 2.38 | Holice (o.Pardubice) | 282 | 4.49 | Nové Město na Moravě (o.Žďár n.Sáz.) | 219 | 2.08 |
| Strakonice | 517 | 2.16 | Zábřeh (o.Šumperk) | 282 | 1.94 | Kostelec nad Orlicí (o.Rychnov n.Kn.) | 217 | 3.49 |
| Svitavy | 515 | 2.96 | Litvínovice (o.Č.Budějovice) | 281 | 22.07 | Rudoltice (o.Ústí n.Orl.) | 216 | 22.78 |
| Klatovy | 510 | 2.22 | Humpolec (o.Pelhřimov) | 281 | 2.54 | Milevsko (o.Písek) | 215 | 2.28 |
| Děčín | 506 | 0.96 | Česká Lípa | 280 | 0.71 | Litomyšl (o.Svitavy) | 215 | 2.09 |
| Rožnov pod Radhoštěm (o.Vsetín) | 498 | 2.82 | Týnec nad Sázavou (o.Benešov) | 279 | 5.25 | Domažlice | 214 | 1.94 |
| Lanškroun (o.Ústí n.Orl.) | 490 | 4.96 | Holýšov (o.Domažlice) | 279 | 6.07 | Nový Bor (o.Česká Lípa) | 213 | 1.73 |
| Kadaň (o.Chomutov) | 475 | 2.67 | Veselí nad Lužnicí (o.Tábor) | 275 | 4.16 | Moravský Krumlov (o.Znojmo) | 213 | 3.48 |
| Havířov (o.Karviná) | 474 | 0.55 | Slavkov u Brna (o.Vyškov) | 274 | 4.61 | Skuteč (o.Chrudim) | 211 | 3.97 |
| Uherský Brod (o.Uher.Hradiště) | 473 | 2.68 | Varnsdorf (o.Děčín) | 272 | 1.70 | Jeseník | 211 | 1.66 |
| Chrudim | 470 | 1.97 | Uničov (o.Olomouc) | 272 | 2.19 | Dolany (o.Olomouc) | 211 | 10.46 |
| Jičín | 461 | 2.80 | Šumperk | 271 | 0.93 | Letohrad (o.Ústí n.Orl.) | 210 | 3.35 |
| Vysoké Mýto (o.Ústí n.Orl.) | 458 | 3.73 | Slaný (o.Kladno) | 270 | 1.76 | Hořovice (o.Beroun) | 209 | 3.23 |
| Čelákovice (o.Praha-východ) | 453 | 4.44 | Chlumec (o.Ústí n.Lab.) | 269 | 6.63 | Šternberk (o.Olomouc) | 208 | 1.47 |
| Trutnov | 453 | 1.42 | Teplice | 268 | 0.52 | Planá (o.Tachov) | 206 | 3.77 |
| Čáslav (o.Kutná Hora) | 449 | 4.50 | Kyjov (o.Hodonín) | 266 | 2.15 | Pohořelice (o.Břeclav) | 205 | 4.67 |
| Rychnov nad Kněžnou | 448 | 3.83 | Sulice (o.Praha-východ) | 263 | 32.17 | Vracov (o.Hodonín) | 205 | 4.54 |
| Ostrov (o.Karlovy Vary) | 447 | 2.55 | Jaroměř (o.Náchod) | 262 | 2.03 | Chýně (o.Praha-západ) | 204 | 32.01 |
| Šestajovice (o.Praha-východ) | 445 | 32.71 | Dvůr Králové nad Labem (o.Trutnov) | 260 | 1.58 | Moravská Třebová (o.Svitavy) | 204 | 1.77 |
| Náchod | 443 | 2.08 | Bystřice pod Hostýnem (o.Kroměříž) | 260 | 2.95 | Holešov (o.Kroměříž) | 204 | 1.64 |
| Poděbrady (o.Nymburk) | 440 | 3.32 | Orlová (o.Karviná) | 260 | 0.74 | Ždírec nad Doubravou (o.Havl.Brod) | 203 | 7.09 |
| Vestec (o.Praha-západ) | 439 | 48.12 | Žatec (o.Louny) | 259 | 1.30 | Cheb | 201 | 0.62 |
| Jindřichův Hradec | 435 | 1.90 | Česká Třebová (o.Ústí n.Orl.) | 259 | 1.53 | Bučovice (o.Vyškov) | 201 | 3.16 |
| Harrachov (o.Semily) | 432 | 25.51 | Příbram | 258 | 0.72 | |||
| Železná Ruda (o.Klatovy) | 429 | 21.75 | Kunovice (o.Uher.Hradiště) | 257 | 4.98 | |||
2) Averaged mid-year population
5. Acquisition value of dwellings
The most important characteristics of quality of completed dwellings are the acquisition value, which is given for the whole construction. This concept refers to total estimated investment costs of construction (minimum is the amount given in the building application documents – approximate costs of construction including technology). The total acquisition value does not include price of the building site. In 2006 the total acquisition value of all dwellings completed in the Czech Republic reached approx. CZK 61.8 billion.
The tendency of rising costs of construction of new residential buildings continued (interrupted by a stagnation in 2000 and 2001). In 2006 the acquisition value per dwelling in a new family house stood at CZK 2 848.9 thous., which was by over CZK 700 thous. more than in 1997.
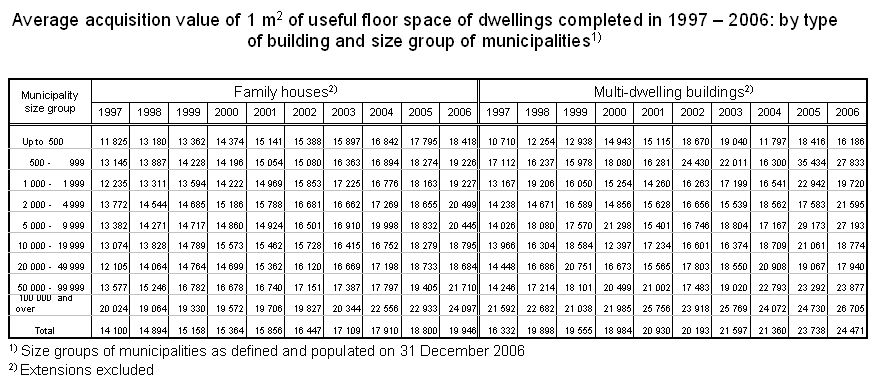
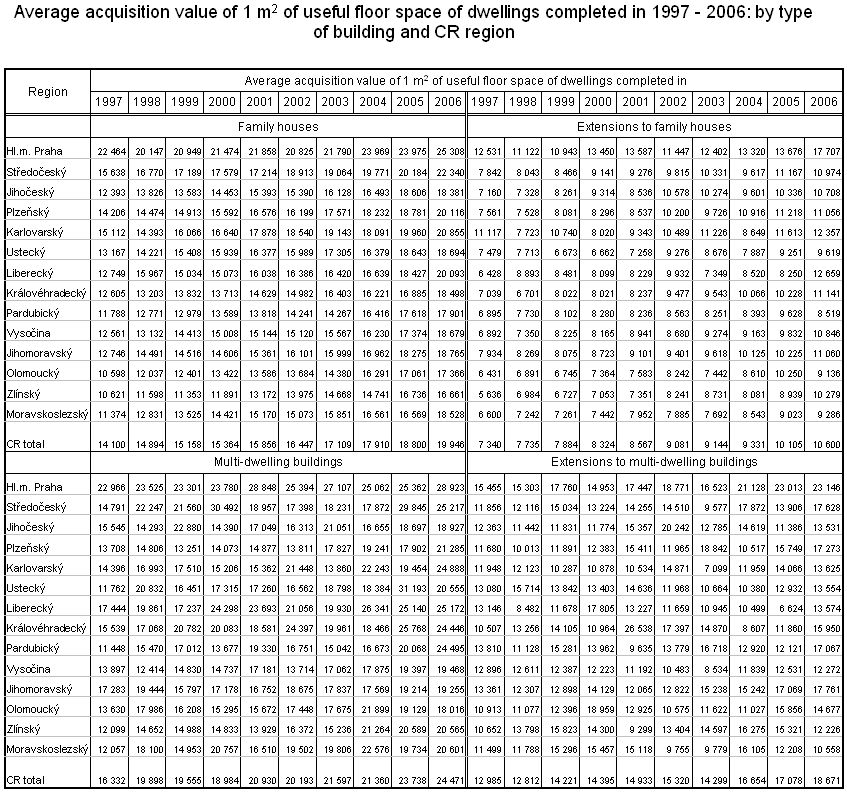
Since the information on average acquisition value per dwelling does not show differences in three- and two-dimensional size of dwellings and houses, it is convenient for evaluation of construction price development to recalculate the overall acquisition value to a square or cubic unit of the new dwelling. The acquisition value per 1 m3 of building volume, which is an important economic indicator for building owners, has been growing since 1997 even faster than the average costs of acquisition of a dwelling. During the ten years, the indicator increased for family houses by 66.4%. In 2006 1 m3 cost CZK 3 743. A considerably lower, but also steady rate of growth was reported for prices per 1 m2 of living floor space (+25.9% to CZK 29 090) and per 1 m2 of useful floor space (+41.5% to CZK 19 946).