Producer price indices - 3. quarter of 2006
Product Code: e-7032-06
Producer price indices in the third quarter of 2006
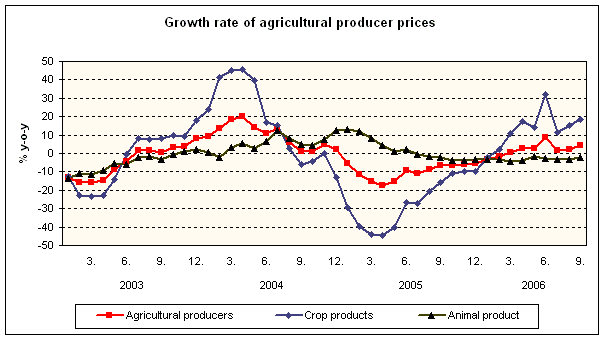
Prices of agricultural producers were up by 2.6% year-on-year in Q3 2006 (by 4.7% in Q2 2006). The growth was affected by prices of crop products, which rose by 15.1%. The prices of animal products were lower by 2.9%.
Rise in the prices of crop products was influenced mainly by higher prices of potatoes (+92.8%), vegetables (+8.8%) and fruit (+9.2%). The prices of oil plants were up by 17.4% and prices of cereals by 10.8%. Decrease in the prices of animal products was predominantly due to lower prices of poultry (-9.4%). The prices of milk (-6.0%) and eggs (-4.9%) were down as well.
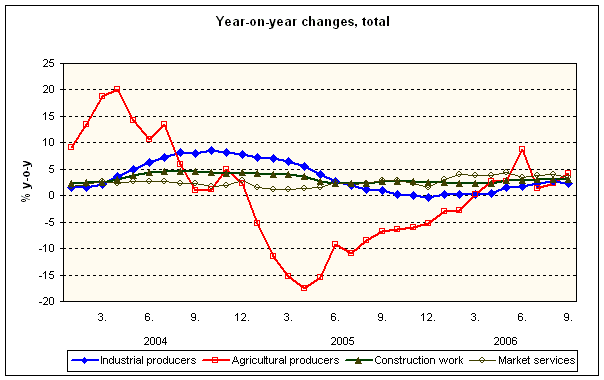
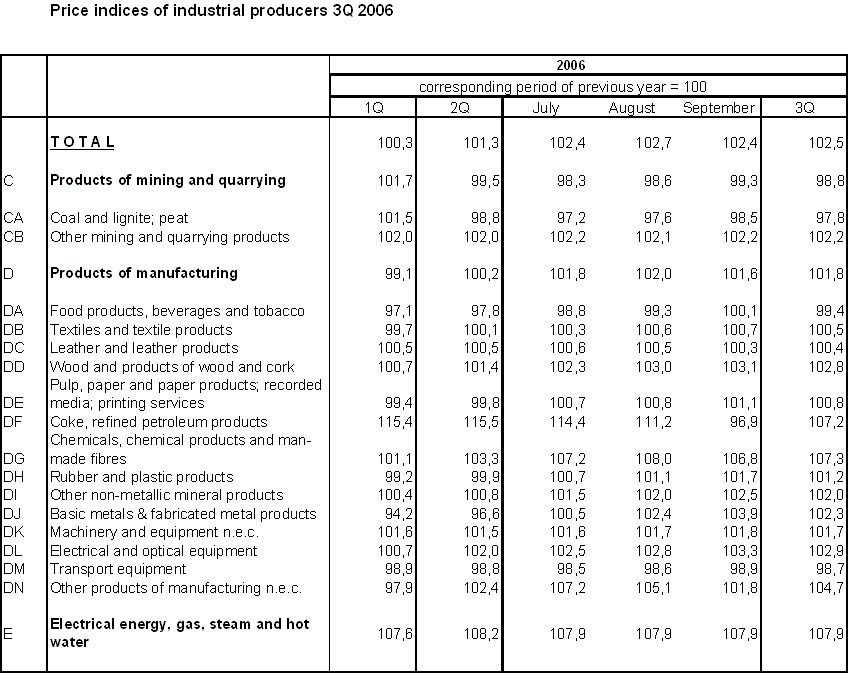
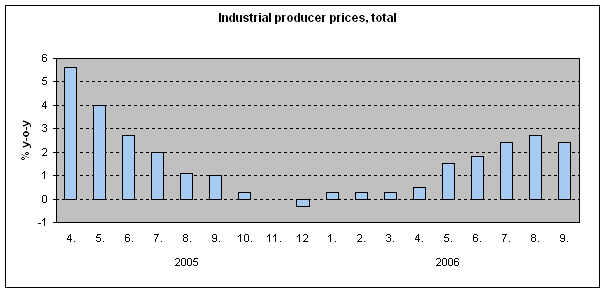
Industrial producer prices increased year-on-year by 2.5% in Q3 2006 and their growth gradually accelerated during the year (+0.3% in Q1, +1.3% in Q2).
In Q3 2006, the overall price level was still affected especially by prices of energy. Even though their growth did not increase any further; the total increase of energy prices is very considerable and acts as one of the growth factors affecting the overall price level. In ‘ electrical energy, gas, steam and water’ the prices were up by 7.9% year-on-year in Q3 2006 of which prices of electricity including distribution and steam and hot water supply services increased most markedly (+9.4% and + 6.5%, respectively).
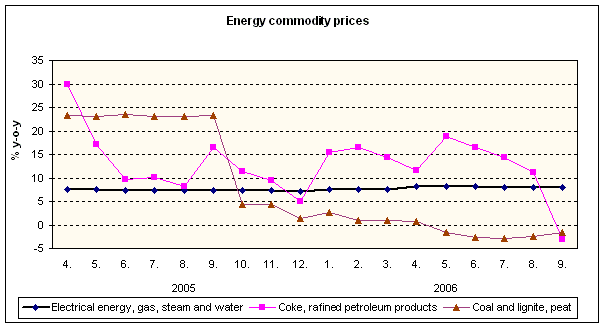
In ‘ coke, refined petroleum products’ prices were higher by 7.2% year-on-year in Q3 2005. The growth rate during the quarter changed from 14.4% in July, 11.2% in August to a drop of 3.1% in September. Prices in ‘coal, lignite and peat’ were in Q3 lower by 2.2% year-on-year. Their prices grew mainly in 2005 and hence increased the comparative base for 2006.
There was also a marked increase of prices in ‘chemical products and man-made fibres’ by 7.3% in Q3 2006 (in Q2 2005 only by 3.3%). Mainly prices of basic chemicals increased (+12.4%).
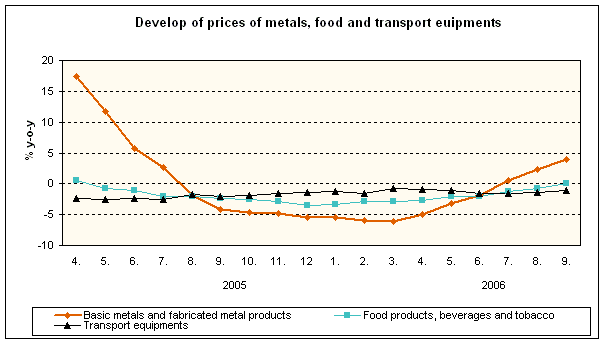
An increasing influence had also prices of ‘ basic metals and fabricated metal products’. For the first time (after 11 months) they increased in July by 0.5% and by 2.3% year-on-year on average for 3 quarters. Markedly higher were mainly prices of basic precious metals and other non-ferrous metals in Q3 2006. They increased by more than a third (+35.3%). The connection with price movement of metals in world trades is shown in their development. In London’s stock market copper was sold for 7 693,48 USD/t in August 2006 (in August 2005 its price was 3 797,64 USD/t) and aluminium was sold for 2 469,50 USD/t (in August 2005 it was 1 865,98 USD/t).
Conversely, prices of ‘ food products, beverages and tobacco’ had a deflationary trend also in Q3 2006. Prices were below the level of prices from same periods of the previous year (16 months), in September however they increased for the first time by 0.1%. On average their prices were in Q3 2006 still lower in total (by 0.6%). Among individual commodities prepared animal feeds’ (5.3%), ‘meat and meat products’ (1.1%) and ‘dairy products’ (2.5%) remained cheaper. For ‘grain mill products, starches and starch products’ and ‘bread, fresh pastry goods and cakes’ producers raised the prices (in Q3 by 2.0% and 4.9%). Different influences contributed to the increase. The growth of energy prices and further growth of bread wheat prices. Its price rose from CZK 2 559 per t in August 2005 to CZK 2 860 per t in August 2006 (it was also more expensive on the world market where wheat was sold for 381,95 USc/bushel in August 2006, i.e. by 62,98 USc/bushel more than in August 2005)
‘ Transport equipment’ belongs among those industries where prices remain low in the long term. In Q3 2006 they were by 1.3% cheaper (year-on-year drops have been lasting since August 2004)
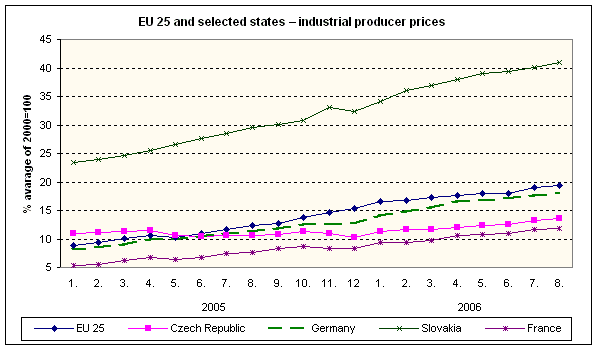
In comparison to the European Union (according to preliminary data), the development of industrial producer prices in the Czech Republic is becoming closer to that in the EU25 in the long term. This applies mainly to the first half of 2005. After that, the growth of prices in the Czech Republic slowed down. Compared to 2000, prices in the Czech Republic in August 2006 were up by 13.6% and in the EU25 by 19.3%. Prices in France (+11.9%) and Lithuania (+16.0%) grew at a similar rate like in the Czech Republic. Germany observed a 17.9% increase. High above-the-EU25-average increases against 2000 were registered in Hungary (year-on-year growth of 52.7%) and also Denmark (+41.9%) and Slovakia (+40.9%).
In the shorter term (year-on-year), however, the Czech Republic is a country where the growth of industrial producer prices is the slowest. On average in the EU25, prices were up by 6.2% in August. In the Czech Republic by a mere 2.7%. In Germany they increased by 5.9% and in Slovakia by 8.8%. The highest year-on-year increases in August were reported for the Luxembourg (+16.7%), Hungary (+11.1%) and Denmark (+11.0%); the lowest in Ireland (+1.8%) and Slovenia (+2.5%).
Construction work prices were up by 3.1% year-on-year in Q3 2006; construction material input prices by 2.0%.
Prices of market services were higher by 3.7% in Q3 2006 (+3.9% in Q2 2006). Of a decisive influence on the development of the overall price level were mainly prices of real estate, renting and business services, which were up by 5.5%. Especially prices of ‘advertising services’ (+18.8%) and prices of ‘architectural, engineering and related technical consultancy services’ (+4.5%) and ‘exhibition, fair and congress organisation services’ (4,3 %) grew. Prices in financial intermediation services, except insurance and pension funding services grew by 2.7% year-on-year in Q3 2006 due to higher prices of ‘monetary intermediation services’ by 3.9%. Insurance prices rose by 1.8% in Q3 2006. The prices of motor vehicle insurance services (+2.5%) grew, while the prices of fire property insurance services (-0.5%) and prices of theft insurance services (-0.2%) were down. The prices of post and telecommunication services were lower by 0.2% in total in Q3 2006. Prices of ‘national post services’ grew by 0.1% year-on-year, prices of mobile telephone services by 0.4%. Prices of telephone operation (fixed lines) were lower by 0.8%. National freight transportation services saw higher prices by 1.0%. A 3.3% price increase was registered for ‘freight transportation services by road’.
