Producer price indices - 3. quarter of 2005
Product Code: e-7032-05
Producer price indices in the 3rd quarter of 2005
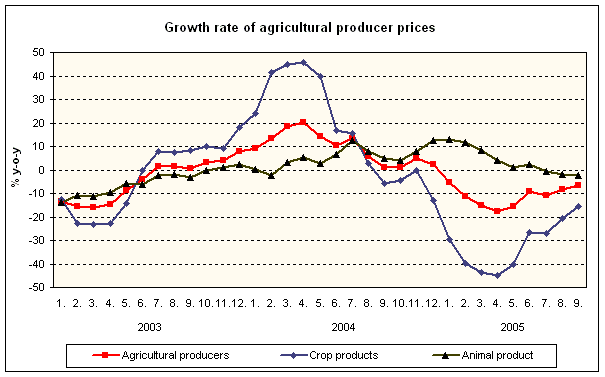
Agricultural producer prices in the 3rd quarter of 2005 (Q3 2005) were lower by 8.8% (-14.1% in Q2) y-o-y. This decrease was affected by crop product prices, which were lower by 21.6% (-37.5% in Q2). Animal product prices were down by 1.6% (+2.4% in Q2).
The decrease of crop product prices was mainly influenced by prices of cereals, which were lower by 27.1%. Prices of potatoes (-16.1%), oil plants (-19.3%) and fruit (-5.1%) fell too. Prices of vegetables were higher by 32.9 (-17.7% in Q2).
The growth of animal product prices was particularly contributed to by prices of cattle for slaughter and milk, which grew by 11.3% and 2.4%, respectively. Prices of eggs (-14.8%), pigs (-7.1%) and poultry (-4.9%) were down.
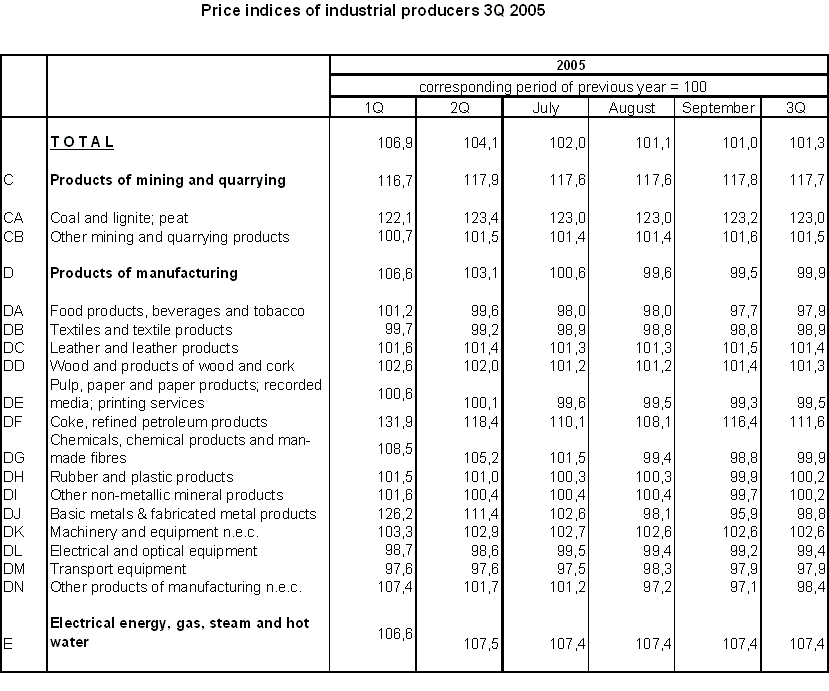
The y-o-y growth rate of industrial producer prices slowed further down in Q3 2005. Whereas y-o-y growth was 6.9% in Q1 2005 and 4.1% in Q2, it dropped to 1.3% in Q3.
The growth rate slackened markedly particularly in basic metals and fabricated metal products and turned into a y-o-y fall of 1.2% in Q3.
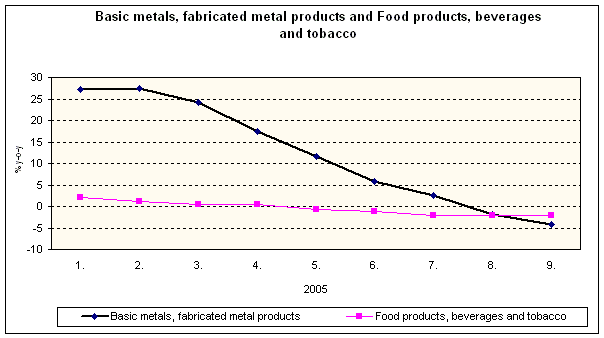
Prices in subsection food products, beverages and tobacco were not a less important influence on the fall of the overall price level in Q3. The prices were lower by 2.1% (-0.4% in Q2). Their drop was closely related to the considerable decrease in crop product prices. The low prices of wheat led in Q3 to price decreases mainly in ‘grain mill products, starches and starch products’ (-14.3%), ‘prepared animal feeds’ (-14.1%) and ‘other food products’ (-1.8%). On the decrease were also prices of oils and fats (-10.7%, due to lower production prices of rape and sunflower seeds). Only prices of beverages (+2.8%) and prices of ‘meat and meat products’ (+0.7%) grew in this CZ-CPA subsection.
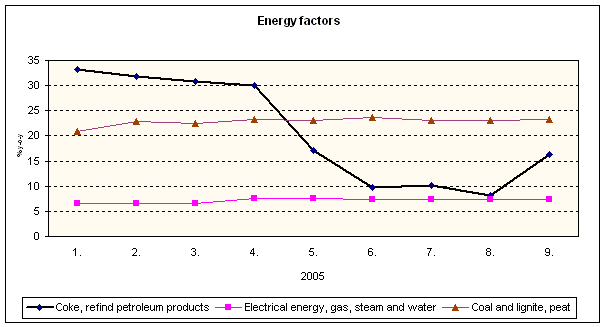
The overall price level was also affected by prices of coke, refined petroleum products and nuclear fuel. Prices in this CZ-CPA subsection were higher by 11.6% y-o-y on average in Q3 2005 (+18.4% in Q2). Prices of ‘refined petroleum products’ grew. Prices of ‘coke oven products’ stopped rising during the year and are now below the level of the corresponding period of 2004 (as a result, they decelerated the price growth in the whole subsection ‘coke, refined petroleum products and nuclear fuel’ in Q3 2005).
In other areas of energy, the y-o-y development of prices in Q3 was basically the same as in preceding quarter. Prices of electrical energy, gas, steam and water were higher by 7.4% (+7.5% in Q2). Higher were in particular prices of ‘production and distribution services of electricity’ by 9.3% (+9.4% in Q2). Prices of ‘coal and lignite; peat’ were higher by 23.0% (+23.4% in Q2).
In comparison to the European Union, industrial producer prices in the Czech Republic grew less y-o-y in Q3 2005. In August 2005, the prices in the CR were higher by 1.1% y-o-y and in the EU25 by 5.1%. The highest increases in August were observed in the United Kingdom (+ 11.1%), Denmark (+ 10.3%), the Netherlands (+ 7.5%) and Hungary (+ 7.4%), the lowest then in Luxembourg (+ 0.2%) and Belgium (+ 0.7 %). In Slovakia and Germany they were higher by 5.6% and 4.6%, respectively.
Construction work prices in Q3 2005 grew by 2.3% y-o-y, construction material input prices rose by 0.8%.
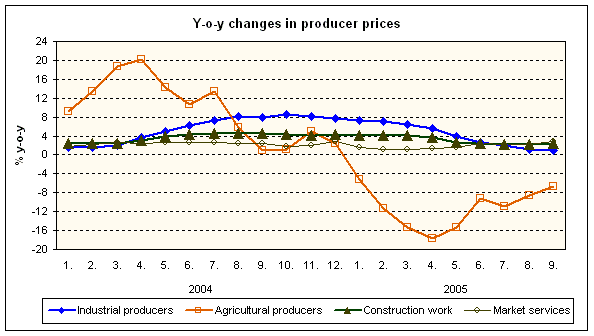
The y-o-y increase in prices of market services in total accelerated and reached 2.4% in Q3 2005 (+1.8% in Q2). Of a decisive effect on the development of the overall price level were particularly prices of real estate, renting and business services, which grew by 1.9%. In this CZ-CPA section, particularly prices of ‘advertising services’ (+3.0%) and ‘computer and related services’ (+5.1%) grew; on the other hand, prices of ‘real estate services’ (-0.6%) and ‘exhibition, fair and congress organisation services’ (-0.5%) were lower. Prices of financial intermediation, except insurance and pension funding were up by 2.1% y-o-y due to higher prices of ‘monetary intermediation services’ (+2.9%). Prices of insurance services rose by 1.2%. Prices of fire insurance grew by 3.3%, prices of insurance against theft by 4.1% and prices of motor car insurance by 0.6%. Prices of post and telecommunication services in total were higher by 4.7% (+0.2% in Q2). Prices of state postal services grew by 15.6% y-o-y due to higher postal charges from February 2005; prices of telephone operation were higher by 13.7%. On the other hand, prices of ‘mobile telephone services’ dropped by 10.8% (switch to new tariffs and temporary reduction of SMS prices). Prices of national freight transport were up by 1.8%. An increase of 2.8% was reported for prices of ‘freight transportation services’ by road.
