Producer price indices - 2. quarter of 2006
Product Code: e-7032-06
Producer price indices in the second quarter of 2006
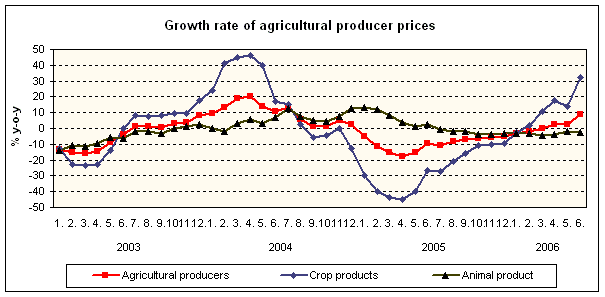
Prices of agricultural producers were up by 4.7% year-on-year in Q2 2006 (in comparison to a decrease of 1.5% in Q1 2006). The growth was affected by prices of crop products, which rose by 21.6%. The prices of animal products were lower by 2.6%.
Rise in the prices of crop products was influenced mainly by higher prices of potatoes (+92.3%), vegetables (+39.4%) and fruit (+28.4%). The prices of oil plants were up by 9.5% and prices of cereals by 3.5% (as against a drop of 4.7% in Q1 2006). Decrease in the prices of animal products was predominantly due to lower prices of poultry (-10.0%). The prices of milk (-4.3%) and pigs (-2.7%) were down too. The prices of cattle for slaughter and eggs were higher by 0.4% and 6.3%, respectively.
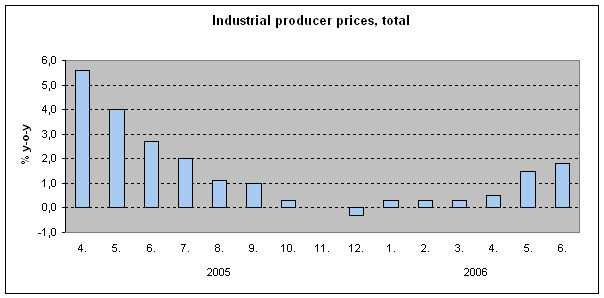
Industrial producer prices were moderately up in Q2 2006 again. The overall price level rose by 1.3% on average (+0.3% in Q1 2006). In comparison to Q2 2005, when prices were up by 4.1%, the increase appears moderate, but the intensity of growth in individual months of Q2 2006 was markedly rising. Prices grew by 0.5% in April year-on-year and by 1.8% in June; the latter is the highest figure over last 11 months.
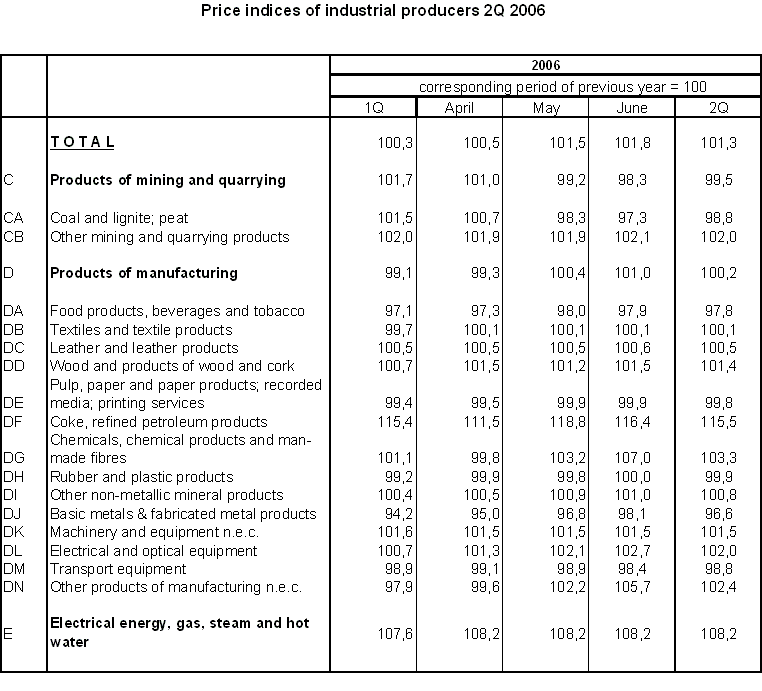
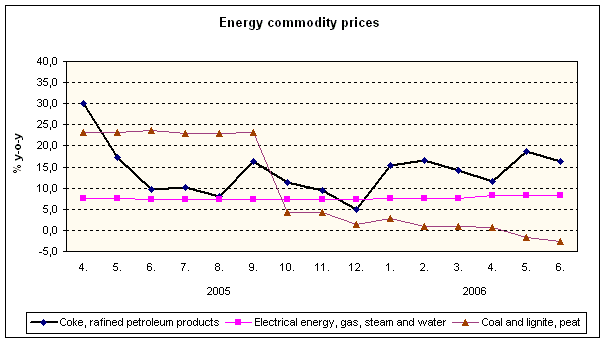
The overall price level is affected especially by price development in ‘electrical energy, gas, steam and water’ where the prices were up by 8.2% year-on-year in Q2 2006. These commodities grew faster than in Q1 2006 (+7.6% in Q1 2006) and faster than in Q2 2005 (+7.5% in Q2 2005).
Price development in ‘coke, refined petroleum products’ was the second significant factor that contributed to the growth of the total index. The prices were up by 15.5% year-on-year in Q2 2006. In comparison to Q1 2006 (+15.4%) they hardly changed, and in comparison to Q2 2005 (+18.4%) the growth slowed down. Throughout the first half of 2006, the year-on-year price increases ranged between 11.5% and 18.8%.
Price development in ‘chemical products and man-made fibres’ (+3.3% year-on-year in Q2 2006) was the third most important upward factor. A comparison to Q1 2006 (+1.1%) shows a considerable increase. The price development in individual months of Q2 2006 had a markedly growing tendency. Prices in March 2006 were still down (-0.3%) year-on-year, but grew highly (+7.0%) three months later. Intensity like that within a quarter was recorded for none of the other branches of the economy. Compared to Q2 2005 (+5.2%), the price growth slowed down. The prices of ‘basic chemicals’ and ‘other chemicals’ grew most (+5.5% and 4.9%, respectively) year-on-year in Q2 2006.
Conversely, prices of ‘food products, beverages and tobacco’ were the main downward factor. They were down by 2.2% in Q2 2006; year-on-year decreases were registered in last 14 months. In comparison to Q2 2005 when prices were down by 0.4% year-on-year, decrease is higher. Compared to Q1 2006 (-2.9%), decrease slowed down. The highest year-on-year decreases in Q2 2006 were recorded for ‘prepared animal feeds’ (-8.9%), ‘meat and meat products’ (-2.2%) and ‘other food products’ (-1.8%).
The overall price level was significantly influenced by prices of ‘basic metals and fabricated metal products’. Prices in this CPA subsection saw a fall that began in August 2005. While the prices were still higher year-on-year in Q2 2005 (+11.4%), they fell in Q2 2006 (-3.4%). In comparison to Q1 2006 (-5.8%), the fall decelerated. An increase in the prices of non-ferrous metals, in particular copper and aluminium (+27.4% of the year-on-year increase in prices of basic metals and fabricated metal products in Q2 2006) produced pro-inflationary affects in this CPA subsection.
Also the prices of ‘transport equipment’ have been falling for eight successive quarters (-1.2% in Q2 2006). They hardly changed against Q1 2006 (-1.1%) and the decrease slowed down against Q2 2005 (-2.4%). The decrease in the prices of transport equipment was most affected by prices of ‘parts and accessories for motor vehicles and their engines’ (-3.2% in Q2 2006).

In comparison to the European Union, the development of industrial producer prices in the Czech Republic is becoming closer to that in the EU25 in the long term. This applies mainly to the first half of 2005. After that, the growth of prices in the Czech Republic slowed down. Compared to 2000, prices in the Czech Republic in May 2006 were up by 12.4% and in the EU25 by 17.9%. Prices in Lithuania (+12.1%) and France (+10.8%) grew at a similar rate like in the Czech Republic. Germany observed a 16.7% increase. High above-the-EU25-average increases against 2000 were registered in Hungary (+45.4% in May) and Slovakia (+39.0%).
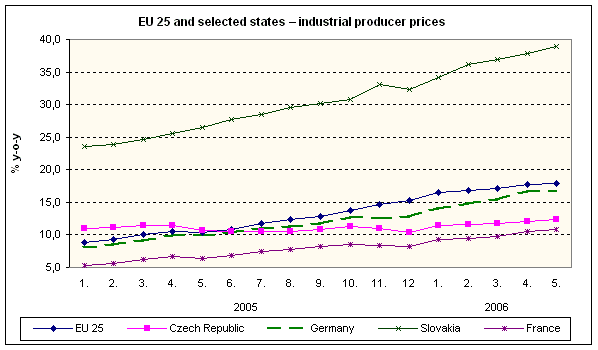
In the shorter term (year-on-year), however, the Czech Republic is a country where the growth of industrial producer prices is slowest. On average in the EU25, prices were up by 6.9% in May. In the Czech Republic by a mere 1.5%, in Germany by 6.2%. Conversely, the highest year-on-year increases were reported for United Kingdom (+12.1%) and Slovakia (+9.9%).
Construction work prices were up by 2.5% year-on-year in Q2 2006; construction material inputs prices were down by 0.3%.
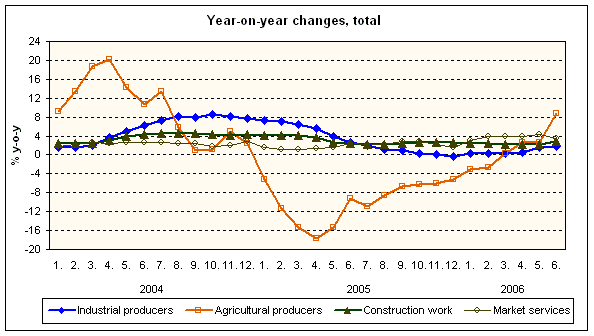
Prices of market services were higher by 3.9% in Q2 2006. Of a decisive influence on the development of the overall price level were mainly prices of real estate, renting and business services, which were up by 4.7%. Especially prices of ‘advertising services’ (+15.8%) and prices of ‘architectural, engineering and related technical consultancy services’ (+4.7%) grew. Prices in financial intermediation services, except insurance and pension funding services grew by 2.9% year-on-year in Q2 2006 due to higher prices of ‘monetary intermediation services’ by 3.9%. Insurance prices rose by 1.8%. The prices of motor vehicle insurance services (+2.5%) grew, while the prices of fire property insurance services (-0.5%) and prices of theft insurance services (-0.2%) were down. The prices of post and telecommunication services were higher by 3.0% in total. Prices of ‘national post services’ grew by 0.1% year-on-year, prices of telephone operation (fixed lines) by 6.0%. National freight transportation services saw higher prices by 1.0%. A 3.2% price increase was registered for ‘freight transportation services by road’.
