Producer price indices - 2 quarter
Product Code: q-7032-10
Compared to Q1 2010, prices of agricultural producers in Q2 2010 increased by 2.2%. Prices of crop products increased by 2.7%, prices of animal products by 1.8%. Prices of potatoes were higher by 25.0%, oil plants by 5.9% and fruits by 0.9%. Prices of vegetables decreased by 14.5%. Among animal products price increase was recorded in cattle and pigs for slaughter both by 0.8% and milk by 4.8%. Prices of eggs decreased by 7.4%.
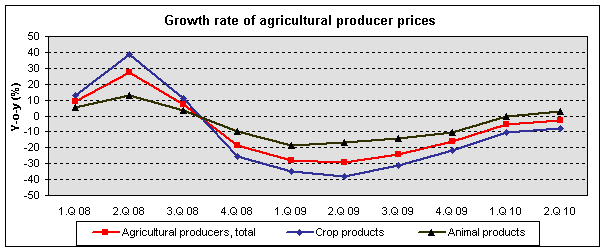
Prices of agricultural producers in Q2 2010 were lower by 2.9% year-on-year. The drop came mainly from crop products, in which prices fell by 8.1%, prices of animal products were higher by 2.9%. Price drop in crop products was due to lower prices of potatoes (-20.0%), cereals (-9.0%), fruit (-8.6%) and vegetables (-3.6%). As for animal products, lower were prices of pigs for slaughter (-12.5%), poultry (-4.1%) and cattle for slaughter (-2.2%). Prices of milk increased by 18.8%.

In the second quarter of 2010 industrial producer prices increased compared to previous quarter by 1.4%. Price increased primarily in ‘coke, refined petroleum products’ (+10.8%), ‘mining and quarrying’ (+7.1%), ‘chemicals and chemical products’ (+5.8%) and ‘basic metals, fabricated metal products’ (+4.6%). Prices decreased mainly in ‘basic pharmaceutical products’ (-1.4%) and ‘food products, beverages and tobacco’ (-1.0%).
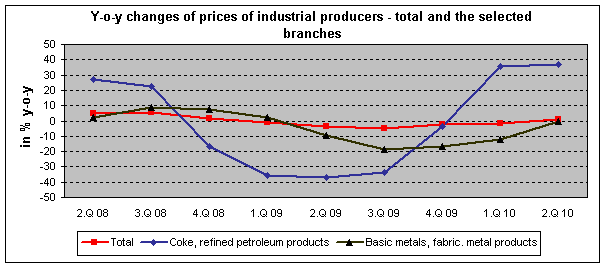
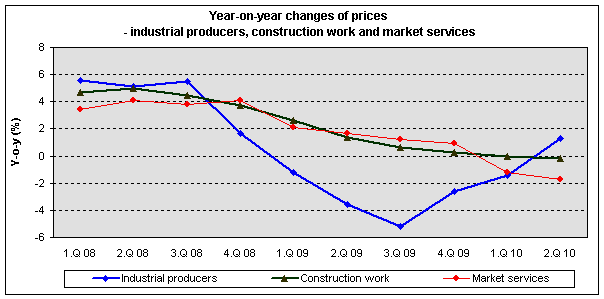
Prices of industrial producer increased by 1.3% in the second quarter of 2010 (-1.4% in the first quarter of 2010), year-on-year. Prices increased the most in ‘coke, refined petroleum products’ (+37.0%) and ‘chemicals and chemical products’ (+17.9%). Prices went down particularly in ‘basic pharmaceutical products’ (-4.6%), ‘transport equipment’ (-4.4%) and ‘food products, beverages and tobacco’ (-3.6%). The largest change recorded the prices in ‘basic metals, fabricated metal products’ by 12.2 p.p. (-12.2% in Q1 2010, no change in Q2 2010) and prices in ‘mining and quarrying’ by 10.5 p.p. (-1.9% in Q1 2010, +8.6% in Q2 2010).

In comparison to Q1 2010, construction work prices in Q2 2010 decreased by 0.2%, prices of construction material input increased by 0.8%.
Construction work prices in Q2 2010 compared to the corresponding period of 2009 were lower by 0.2% year-on-year, prices of construction material input increased by 0.3%.

In comparison to Q1 2010, prices of market services increased by 1.1% in Q2 2010. Higher were mainly prices of advertising and market research by 10.6% and employment activities by 3.3%. Market services prices in total excluding advertising services stayed unchanged.
In Q2 2010, compared to the corresponding period of 2009, prices of market services were lower by 1.7% in total. The development of total price level was affected mainly by prices in advertising and market research, which were lower by 7.6%. On the increase were prices in employment activities by 14.0%. Market services prices in total excluding advertising services decreased by 1.5%.
