Producer price indices - 1. quarter of 2006
Product Code: e-7032-06
Producer price indices in the first quarter of 2006
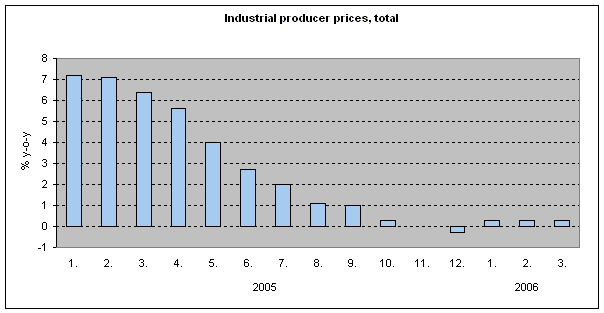
Agricultural producer prices were down by 1.5% year-on-year in Q1 2006. This decrease was affected by animal product prices (-3.5%). Crop product prices were up (+3.4%) year-on-year for the first time since Q4 2004.
The drop of animal product prices was especially due to lower prices of pigs (-7.2%) and poultry (-9.4%). The prices of milk (-2.5%) and eggs (-0.4%) were lower too. Higher prices were registered only for cattle for slaughter (+3.4%).
The price increase in crop products is mainly attributable to higher prices of vegetables (+63.1%), potatoes (+17.2%) and fruit (+11.1%). The prices of cereals were down (-4.7%).
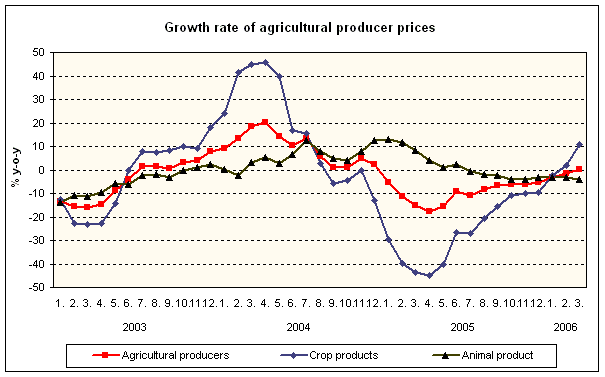
Industrial producer prices grew moderately in Q1 2006. Following a year-on-year stabilisation in November and decrease in December 2005 (-0.3%), they rose by 0.3% on average in Q1 2006. However, the intensity of year-on-year growth was now substantially lower than in Q1 2005, when it reached 6.9%.
The main reason for a lower growth of the overall price level in Q1 2006 was the fact that the dominant growth factors in play in Q1 2005 switched from inflationary environment to deflation or saw a slowdown of price growth.
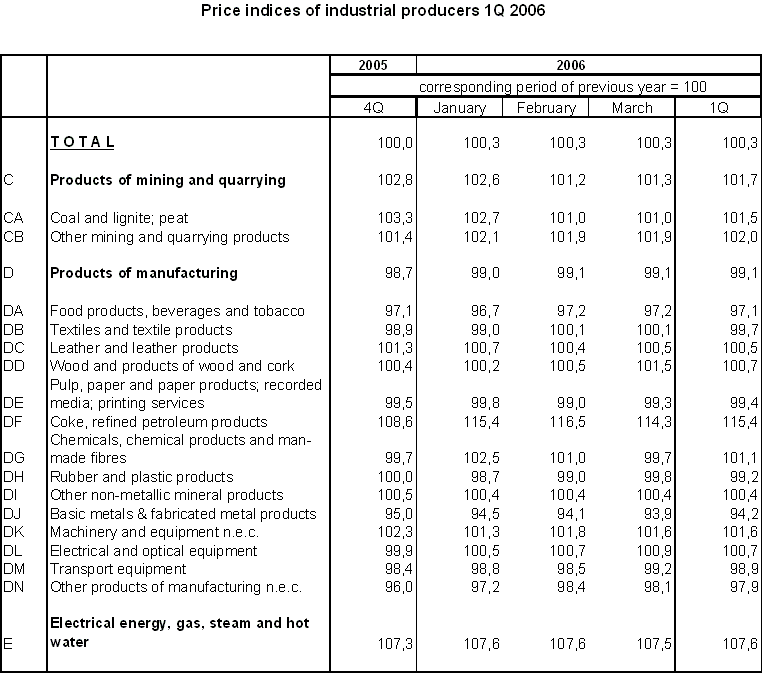
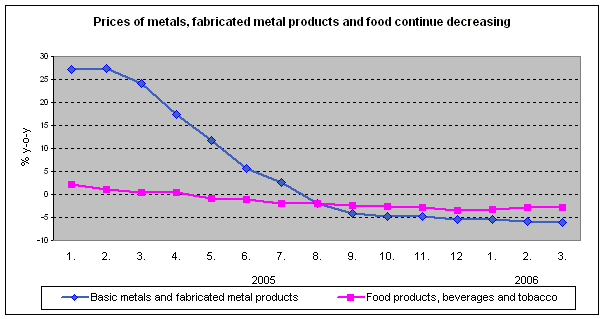
Below the Q1 2005 level were in particular the prices of basic metals and fabricated metal products , which were down by 5.8 year-on-year in Q1 2006 (they rose by more than a quarter in Q1 2005). Decreases in year-on-year prices were observed for most of important commodity groups in this CPA subsection. Cheaper in Q1 2006 were ‘basic iron and steel and ferro-alloys’ (-15.0%), ‘tubes’ (-5.1%) and ‘other first processed iron and steel’ (-7.8%). Industrial producer prices reflected, besides lower demand, decreases in import prices of metal ores in January (-15.9%) and of products of iron and steel (-7.1%). Although producer prices in ‘basic metals and fabricated metal products’ have been falling since August 2005, they are still at a high level (+21.9% in comparison to 2000).
Food products, beverages and tobacco were another important CPA subsection with a reducing effect on the overall price level in Q1 2006. Their prices dropped by 2.9% year-on-year (as against +1.2% in Q1 2005). On the decrease were in particular the prices of ‘grain mill products, starches and starch products’ (-4.6%), ‘prepared animal feeds’ (-10.5%), ‘dairy products and ice cream’ (-2.8%), and ‘meat and meat products’ (-2.1%). When analysing this development, the underlying causes seem to be agricultural producer prices and strong external competition. The prices of agricultural producers fell by 2.3% in January and February 2006. Import prices of some food items were lower too. For example, in January import prices of food industry products were down by 1.1%, of animal and vegetable fats by 7.6%, etc.
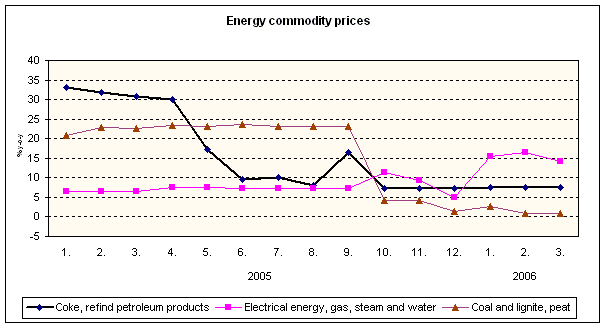
Also the prices of energy had a share in reducing the growth of prices in Q1 2006. Prices in ‘coke and refined petroleum products’ rose by 15.4%, whereas they grew by 31.9% in Q1 2005. A slowdown of growth from 22.1% to 1.5% was recorded for ‘coal, lignite and peat’. The high prices of petroleum in world markets strongly affected the price development of refined petroleum products and subsequently prices in other CPA subsections. In spite of short-term fluctuations, the price of petroleum Brent in world markets has an upward trend in the long run. In January 2006 it sold
for 63.72 USD/barrel on the London Stock Exchange, while in January 2005 for approx. 44 USD/barrel and in January 2004 for 30.63 USD/barrel. One of the implications of growing petroleum prices were higher prices of chemical products and man-made fibres (+1.1%).
Above the Q1 2005 level were the prices of ‘machinery and equipment’ (+1.6%). A 2.0% increase was observed for the prices of ‘metal ores and other mining and quarrying products’ (higher prices of important materials used in construction such as gravel, sand, clay, stone, etc.). The year-on-year growth of prices in other CPA subsections of industry did not exceed one per cent. Such price increases were registered in ‘electrical and optical equipment’ (+0.7%), ‘wood and products of wood and cork (except furniture), articles of straw and plaiting materials’ (+0.7%) and ‘leather and leather products’ (+0.5%).
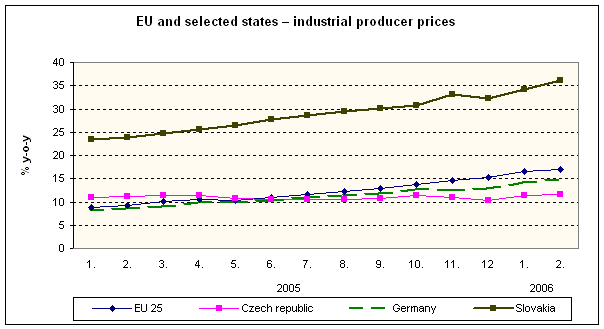
Compared to the price development in the European Union in the long run, the growth of industrial producer prices in the Czech Republic is currently getting near to the growth of prices in the EU25 (albeit the former is more moderate in total). In comparison to 2000, prices in the CR grew by 11.6% and in the EU by 17.0% in February 2006. A price development similar to that in the CR was observed in France (+9.3%) and Germany (+14.9%). Highly above the EU25 average grew prices in Slovakia (+36.1% in total between 2000 and February 2006).
In the short run, however, the recent growth of prices in the CR is among the lower ones (+0.3% year-on-year in February 2006). A relatively moderate increase was recorded also in Slovenia (+1.6%). The average growth of 7.0% in the EU25 in February 2006 was mainly influenced by high price increases in the United Kingdom (+15,8 %), Denmark (+13,1 %) and the Netherlands (+10,8 %).
In Q1 2006, construction work prices rose by 2.4% year-on-year and construction material inputs prices remained constant.
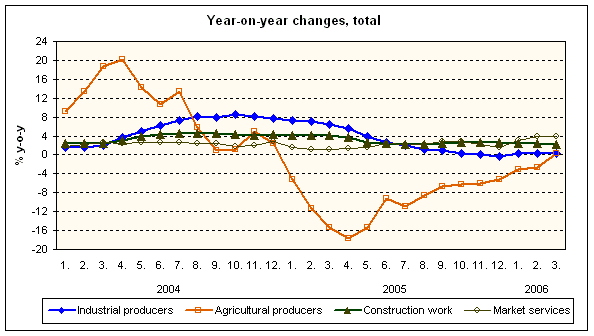
The year-on-year growth of prices of market services accelerated to 3.6% in total in Q1 2006 (+2.3% in Q4 2005). Of a decisive effect on the overall price level development were in particular the prices of real estate, business and renting services (+3.9%). Within this CPA section, higher prices were mainly in ‘advertising services’ (+12.4%) and ‘architectural, engineering and related technical consultancy services’ (+4.2%), while prices dropped in ‘exhibition, fair and congress organisation services’ (-2.3%). Prices in financial intermediation, except insurance and pension funding were up by 2.6% year-on-year in Q1 2006 as a result of a price increase in ‘monetary intermediation services‘ (+3.9%). Insurance prices grew by 0.8%; on the increase were prices of fire property insurance services (+2.1%), prices of theft insurance services (+2.9%) and prices of motor vehicle insurance services (+0.4%). The prices of post and telecommunication services were higher by 4.8% in total. Prices of ‘national post services’ grew by 4.8% year-on-year, prices of telephone operation by 11.0%. On the other hand, prices of ‘mobile telephone services’ fell by 3.6%. National freight transportation services saw higher prices by 1.7%. A 3.5% price increase was registered in ‘freight transportation services by road’.
