External trade - 4. quarter of 2007
Product Code: e-6032-07
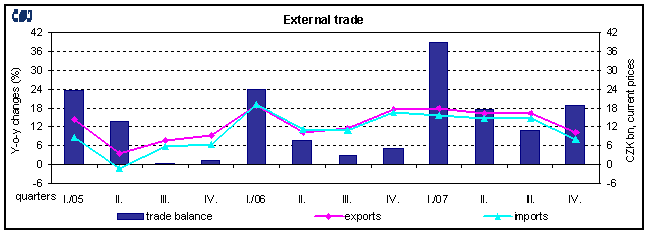
In the year 2007 external trade reached the best figures in the history of the independent Czech Republic . In comparison to 1993 external trade turnover grew 5.7 times to CZK 4 846.1 billion. The Czech economy thus became one of the most open national economies in the European Union. The percentage of the Czech Republic’s external trade within the European Union increased and simultaneously the CR, as the only country among the new EU member states, recorded trade surplus. Exports growing more rapidly than imports resulted in a record trade surplus, more than double that of 2006. Export value per capita grew to CZK 240 thousand in 2007 from nearly CZK 41 thousand in 1993.
The high growth of exports and imports continued in external trade 1 in 2007. In comparison to 2006:
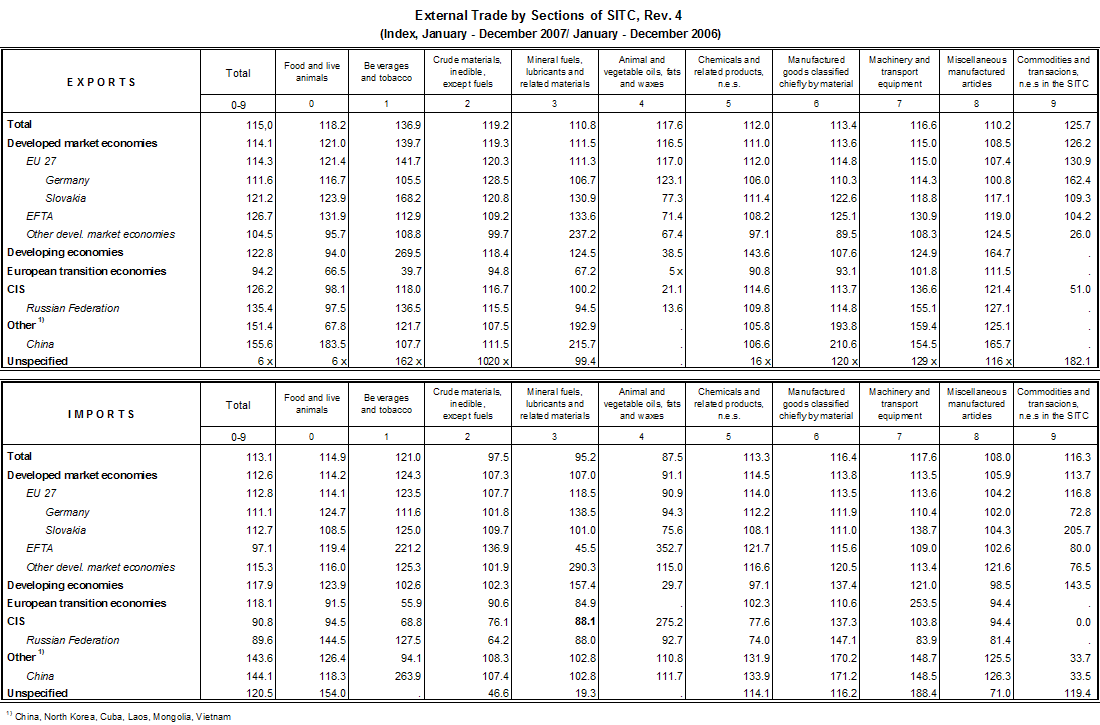
- exports increased by 15.0% year-on-year and reached CZK 2 466.1 billion, imports grew by 13.1% and reached CZK 2 380.0 billion. Increases in exports and imports accounted for 53.9% and 46.1% respectively of the year-on-year growth of external trade turnover, which was CZK 596.7 billion. Due to appreciation of CZK against EUR and even more against USD exports and imports in these foreign currencies grew more – exports and imports in EUR by 17.5% and 15.5% respectively, exports and imports in USD by 28.3% and 26.2% respectively;

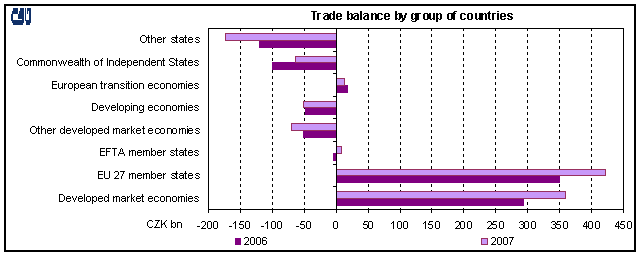
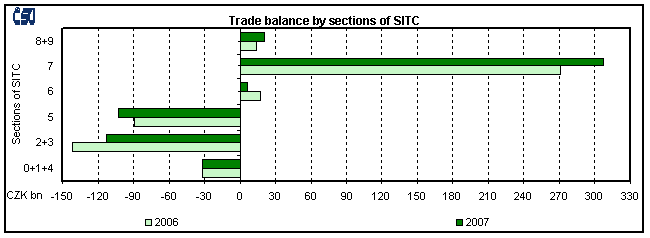
- trade balance reached a surplus of CZK 86.1 billion 2 (the rate of coverage of imports by exports was 103.6% in comparison to 101.9% in 2006), which was by CZK 46.3 billion more year-on-year. A significant part of the trade surplus in 2007 was produced by favourable terms of trade. By group of countries 3 , trade surplus with EU27 states improved by CZK 71.7 billion and trade deficit with non-EU countries deteriorated by CZK 25.4 billion. Trade surplus with EU27 states compensated for the trade deficit with non-EU countries (mainly with China, Japan and the Russian Federation). The surplus with the European transition economies decreased by CZK 2.5 billion year-on-year, trade deficit improved with the Commonwealth of Independent States (by CZK 35.2 billion) and deteriorated with other states 4 by CZK 52.0 billion and with developing economies by CZK 5.1 billion. By commodity section, trade balance improved year-on-year due to a CZK 35.9 billion increase of surplus in ‘machinery and transport equipment’, a CZK 6.3 billion increase of surplus in ‘miscellaneous manufactured articles’ and a CZK 28.3 billion decrease of deficit in ‘crude materials, inedible, and mineral fuels‘; trade balance deteriorated due to a CZK 10.6 billion decrease of surplus in ‘manufactured goods classified chiefly by material’ and a CZK 13.6 billion increase of deficit in ‘chemicals and related products’; trade deficit in ’agricultural and food crude materials and products’ remained at the 2006 level;
- by group of countries, the share of EU27 states in total exports slightly decreased (from 85.7% to 85.1%) and so did in total imports (from 70.7% to 70.5%). A positive feature was that the shares of developing economies and CIS countries in total exports increased. In total imports the strongest increase was recorded for other states (from 6.2% to 7.0%), followed by developing economies; decreases were observed especially for the CIS countries (from 8.2% to 6.6%) and EFTA states;
- by commodity section, the share of ‘machinery and transport equipment’ in total exports rose (from 53.2% to 54.0%) to the detriment of ‘miscellaneous manufactured articles’, ‘manufactured goods classified chiefly by material’ and ‘chemicals and related products’. ‘Machinery and transport equipment’ increased their share also in total imports (from 41.4% to 43.0%). Higher shares in total imports had ‘manufactured goods classified chiefly by material’ and ‘agricultural and food crude materials and products’; on the other hand, significant decreases were registered for ‘crude materials, inedible, and mineral fuels‘ and ‘miscellaneous manufactured articles’.
In comparison to external trade of EU27 states and external trade of the new EU member states, the growth rate of external trade in the Czech Republic has been increasingly better. Data for January–October 2007 released by Eurostat on 17 January 2008 say that EU27 (EU15) exports rose by 6.5% (5.5%) and EU27 (EU15) imports by 5.7% (4.2%) on average year-on-year (based on EUR). Exports and imports of the 12 new member states were higher by 17.0% and 18.6% respectively on average year-on-year. Exports and imports of the 12 new member states grew on average by 18.7% and 20.5% respectively year-on-year. In January–October 2007 the share of the 12 new member states in total EU27 exports increased to 10.1% (from 9.2% in January-October 2006) and their share in total EU27 imports grew to 11.5% (from 10.2% in the same period). The EU27 trade balance reached a EUR 77.6 billion deficit in January–October 2007 (EU15 deficit was EUR 25.4 billion and the 12 new member states’ deficit EUR 52.2 billion). As one of the few EU member states and the only one among the new EU member states, the Czech Republic recorded a trade surplus in the same period.
The external trade figures in 2007 were affected by:
- the continuing (albeit lower) growth of industrial production. In January–November 2007 the y -o-y industrial production index reached 108.7 (of which in ‘manufacturing’ 109.4). Above-the-average year-on-year increases were recorded in ‘manufacture of rubber and plastic products’, ‘manufacture of machinery and transport equipment’, ‘manufacture of electrical and optical equipment’, ‘manufacture of other non-metallic mineral products’, ‘manufacture of transport equipment’ and ‘manufacture of wood and wood products’. The rise in manufacturing industries 5 contributed decisively (by 95.3%) to the year-on-year increase of total exports. Manufacturing exports in 2007 were by 14.8% (CZK 306.5 billion) higher than in 2006.
The most dynamic items of manufacturing exports in 2007 were ‘machinery and transport equipment’, of which ‘telecommunications equipment’, ‘other transport equipment’, ‘metalworking machinery’ and ‘machinery specialised for particular industries’. ‘Road vehicles’ retained the strongest position in exports. Exports of road vehicles made up 16.6% of total exports (in 2006 17.1%), of which exports of passenger cars 8.2% (in 2006 9.0%) and exports of ‘parts and accessories for motor vehicles’ 7.0% (in 2006 6.9%). External trade in road vehicles produced the highest surplus among all SITC classes, which was up by CZK 16.1 billion year-on-year, of which surplus in passenger cars grew by CZK 2.0 billion and surplus in ‘parts and accessories for motor vehicles’ by CZK 13.1 billion. The second largest surplus in trade in machinery and in total external trade as well was registered for ‘general industrial machinery and equipment’ (CZK 40.1 billion);
- foreign direct investment in manufacturing industries whose inward flows continued in 2007. In January–November 2007 net FDI inward flows amounted to CZK131.8 billion 6 in total. Like in the previous years 7 , significant volume of FDI went in manufacturing industries, predominantly in ‘manufacture of chemicals, chemical products and man-made fibres’, ‘manufacture of basic metals and fabricated metal products’, ‘manufacture of machinery and equipment’, ‘manufacture of food products, beverages and tobacco’ and ‘manufacture of electrical machinery and apparatus’. Decisive part of FDI came from EU investors (from the Netherlands, Luxembourg, Austria, Belgium, Poland and France) and from the US and Korea;
- favourable terms of trade. 8 In January–November 2007, in comparison to January–November 2006, export and import prices were up by 1.7% and down by 1.0% respectively on average. The terms of trade figure reached 102.7. External trade prices were affected among other things by CZK/EUR and CZK/USD exchange rates and by price development in the world market. In January–December 2007, compared to January–December 2006, CZK appreciated by 2.1% and 11.3% against EUR and USD respectively on average. The world prices of raw materials and food increased by 7.8% 9 on average year-on-year in 2007. This growth was influenced by a year-on-year increase in oil prices (+9.7%) and natural gas prices (+1.3%); the world prices of the predominating majority of commodities grew more than the average (e.g., world prices of metals 22.6%, textile raw materials 15.6%, and food and oils 17.9%). Just oil prices and natural gas prices, together with lower volumes imported (by 8.0% and 10.9% year-on-year respectively), had a favourable impact on the trade balance. In 2007 trade deficit in ‘petroleum, petroleum products and related materials’ made up CZK 104.7 billion (down by CZK 2.3 billion year-on-year) and trade deficit in ‘gas, natural and manufactured’ was CZK 48.0 billion (down by CZK 11.2 billion year-on-year);
- economic growth (though slower) in the EU member states. Economic development in EU countries was affected mainly by the continuing (but less intense) economic growth in Germany. According to preliminary figures, German economy grew in 2007 by 2.5% year-on-year (in 2006 by 2.9%). Economic development in Germany was very important for external trade because Germany was the destination for 31.0% of the Czech Republic’s exports in 2007. The CR’s exports are also supported by rapid economic growth in Slovakia, the second most important export destination with a share of 8.9% in 2007.
A more detailed view of external trade by group of countries in 2007 shows that, in comparison to the year 2006:
- exports to all groups of countries increased, except for exports to European transition economies. Above-the-average growth was observed in exports to other states (in particular to China), CIS countries (the Russian Federation), EFTA states (Norway and Switzerland) and developing economies (India and Korea). The rate of growth of exports to EU27 states was below the average. Out of the absolute increase in total exports, nearly 82% (CZK 262.2 billion) is attributable to increase in exports to EU27 states. The rise in exports to EU27 states reflected different growth rates of exports to individual EU27 member states. Exports to 14 EU27 member states increased more than the average – for example exports to Sweden, Poland, Slovakia, the United Kingdom, Italy, Hungary and Romania. Below-the-average increases were registered, e.g., in exports to Austria, the Netherlands, France, Spain and Germany. The year-on-year growth of CZK 79.1 billion in exports to Germany was the highest among the EU27 and contributed by nearly a quarter to the increase of total exports and by over 30% to the growth of exports to EU27 states;
- imports from all groups of countries grew, except for imports from the CIS countries (lower imports from the Russian Federation, Kazakhstan and Azerbaijan) and from the EFTA states (lower imports from Norway). Above-the-average increases were recorded in imports from European transition economies, developing economies (mainly from Thailand, Singapore, India, Korea and Malaysia) and other developed market economies (Japan); high increases (in both relative and absolute terms) occurred in imports from other states (mainly China). Imports from EU27 states grew below the average. The increase (in absolute terms) in imports from EU27 states (by more than CZK 190 billion) made up 69% of increase in total imports. Imports from 13 EU27 states grew more than the average – for example imports from Ireland, Hungary, Sweden, the United Kingdom, Poland, Italy and Austria. Slightly below the average growth was registered for imports from Slovakia, France, Belgium, Spain, the Netherlands and Germany. Imports from Romania stagnated. Year-on-year increase of imports from Germany was the highest among all the states and made up nearly a quarter of the total imports growth and nearly 35% of the growth of imports from EU27 states;
- the external trade balance resulted from a surplus with EU27 states (CZK 421.5 billion) and a deficit with the non-EU27 countries (CZK 335.4 billion). The high trade balance deficit with the non-EU27 countries is mainly due to the trade deficit with other states that reached nearly CZK 173 billion (the rate of coverage of imports by exports was 8.4% in comparison to 8.0% in 2006).

The trade balance and year-on-year balance increases/decreases with individual groups of countries reflected the situation of external trade with the main partner states, as documented by the following table:
Balance of trade with selected countries | |||||||
| EU member states | 2006 | 2007 | Y-o-y changes | Non-EU countries | 2006 | 2007 | Y-o-y changes |
CZK billion | CZK billion | ||||||
| Germany | 85.6 | 98.2 | 12.6 | China | -119.2 | - 170.7 | - 51.5 |
| Slovakia | 67.6 | 91.4 | 23.8 | Japan | - 54.5 | - 66.9 | - 12.4 |
| United Kingdom | 47.4 | 59.8 | 12.4 | Russian Federation | - 83.6 | - 55.3 | 28.3 |
| Austria | 31.0 | 25.0 | - 6.0 | Taiwan | - 24.4 | - 23.8 | 0.6 |
| France | 18.1 | 23.5 | 5.4 | Azerbaijan | - 20.8 | - 19.5 | 1.3 |
| Belgium | 19.6 | 22.9 | 3.3 | Korea | - 13.4 | - 16.7 | - 3.3 |
| Romania | 15.4 | 20.1 | 4.7 | Malaysia | - 13.5 | - 16.2 | - 2.7 |
| Spain | 17.4 | 19.5 | 2.1 | Thailand | - 10.0 | - 14.6 | - 4.6 |
| Sweden | 12.1 | 16.1 | 4.0 | United states | 0.1 | - 4.2 | - 4.3 |
| Poland | 2.6 | 11.6 | 9.0 | Ukraine | 6.9 | 9.9 | 3.0 |
| Hungary | 13.2 | 9.2 | - 4.0 | Croatia | 8.1 | 9.5 | 1.4 |
| Italy | 0.8 | 6.3 | 5.5 | Norway | - 5.0 | 3.9 | 8.9 |
Changes in the commodity structure of external trade in 2007, in comparison to 2006, were characterised in:
- machinery and transport equipment by an above-the-average growth of exports and especially of imports and thus by a higher share of these products in total exports and total imports. Higher exports (imports) of ‘machinery and transport equipment’ by CZK 189.1 billion (by CZK 153.3 billion) accounted for 58.8% (55.7%) of increase in total exports (total imports). Surplus of trade in machinery and transport equipment reached CZK 306.9 billion and made up 23.1% of machinery exports. The highest surplus was produced in trade in ‘road vehicles’ (CZK 202.0 billion), followed by ‘general industrial machinery and equipment’ (CZK 40.1 billion) and ‘office machines and automatic data-processing machines’ (CZK 24.2 billion) which was by CZK 6.4 billion lower year-on-year;
- manufactured goods classified chiefly by material by a below-the-average increase in exports and above-the-average increase in imports. Thus the share of these goods decreased in total exports and rose in total imports. The trade surplus dropped considerably (from CZK 16.7 billion to CZK 6.1 billion) year-on-year. This fall was due to the growth of deficits in ‘iron and steel’ by CZK 10.3 billion and ‘non-ferrous metals’ by CZK 9.5 billion. The highest surpluses were concentrated in ‘manufactures of metals’ (CZK 33.5 billion), ‘non-metallic mineral manufactures’ (CZK 27.9 billion) and ‘rubber manufactures, n.e.s.’ (CZK 22.4 billion);
- miscellaneous manufactured articles, commodities and transactions not classified elsewhere in the SITC by below-the-average growth of exports and especially of imports, which made the surplus rise by CZK 6.3 billion year-on-year and the share of these products in total exports and total imports drop. A slight growth of surplus was recorded for ‘prefabricated buildings, sanitary, plumbing, heating and lighting fixtures and fittings, n.e.s.’; surplus in ‘furniture and parts thereof’ (CZK 20.6 billion) remained at the 2006 level. Trade balance of ‘miscellaneous manufactured articles’ improved due to deficit decreases in ‘articles of apparel and clothing accessories’, ‘professional, scientific and controlling instruments and apparatus, n.e.s.‘, and in particular due to deficit CZK 6.3 billion turning into surplus CZK 0.4 billion in a number of products;
- chemicals and related products by higher increase of imports than of exports. Trade deficit in these products was the second highest (CZK 102.7 billion) and rose year-on-year by CZK 13.5 billion. The large deficit (up by CZK 7.3 billion year-on-year) kept on concentrating in ‘medicinal and pharmaceutical products’. Trade deficit in ‘plastics in primary forms’ grew by CZK 3.2 billion year-on-year and in ‘plastics in non-primary forms’ by CZK 0.7 billion;
- crude materials, inedible, and mineral fuels by a below-the-average growth of exports and decrease in imports, which resulted in a year-on-year decrease in the share of these products in total external trade. Trade deficit in this group of products dropped from CZK 141.3 billion to CZK 113.0 billion, yet it remained the highest among all sections of the SITC. Besides the aforementioned deficit in ‘petroleum, petroleum products and related materials’ and ‘gas, natural and manufactured’, the trade balance improved by deficit turning into a high surplus in ‘metalliferous ores and metal scrap’ and by increases of surplus in cork and wood’, ‘pulp and waste paper’ and ‘electric current’;
- agricultural and food crude materials and products by an above-the-average growth of exports and imports. The trade deficit of CZK 31.5 billion remained at the 2006 level. Trade deficit grew in ‘vegetables and fruit’ (by CZK 1.3 billion) and ‘meat and meat preparations’ (by CZK 1.0 billion); trade deficit decreased in ‘tobacco and tobacco manufactures’ (by 0.9 billion); trade surplus fell considerably in ‘sugars, sugar preparations and honey‘ (by CZK 2.8 billion).
External trade balance of products with the biggest effect on the overall trade balance in 2007 | |||
Favourable effect | Adverse effect | ||
| Division of SITC, Rev. 4 | CZK billion | Division of SITC, Rev. 4 | CZK billion |
| 78 Road vehicles | 202.0 | 33 Petroleum, petroleum products and related materials | - 104.7 |
| 74 General industrial machinery and equipment | 40.1 | 68 Non-ferrous metals | - 53.8 |
| 69 Manufactures of metals | 33.5 | 34 Gas, natural and manufactured | - 47.9 |
| 66 Non-metallic mineral manufactures | 27.9 | 54 Medicinal and pharmaceutical products | - 38.0 |
| 75 Office machines and automatic data-processing machines | 24.2 | 67 Iron and steel | - 25.7 |
| 62 Rubber manufactures | 22.4 | 57 Plastics in primary forms | - 20.8 |
| 82 Furniture, and parts thereof | 20.6 | 05 Fruit and vegetables | - 19.7 |
| 35 Electric current | 16.4 | 58 Plastics in non-primary forms | - 16.3 |
| 81 Prefabricated buildings; sanitary, etc., fixtures | 14.7 | 59 Chemical materials and products, n.e.s. | - 13.5 |
| 32 Coal, coke and briquettes | 13.6 | 53 Dyeing, tanning and colouring materials | - 9.9 |
| 72 Machinery specialized for particular industries | 12.9 | 01 Meat and meat preparations | - 9.5 |
| 77 Electrical machinery, apparatus and appliances | 12.4 | 52 Inorganic chemicals | - 6.5 |
| Above divisions of SITC, Rev. 4, total | 440.7 | Above divisions of SITC, Rev. 4, total | - 366.3 |

| Sections of SITC, Rev. 4 | Sections of SITC, Rev. 4 | ||
| 0+1+4 | Agricultural and food crude materials and products | 6 | Manufactured goods classified chiefly by material |
| 2+3 | Crude materials, inedible, and mineral fuels | 7 | Machinery and transport equipment |
| 5 | Chemicals and related products | 8+9 | Miscellaneous manufactured articles, commodities and transactions not classified elsewhere in the SITC |
1 All the data are at current prices. Data for 2006 are final referring to 28 August 2007 closing date. Data for 2007 are as follows: data for January-September updated referring to 28 November 2007 closing date, for October preliminary referring to 28 November 2007 closing date, for November preliminary referring to 3 January 2008 closing date, and for December preliminary referring to 29 January 2008 closing date.
2 External trade balance from the split of the Federation to 2007:
| Years | Trade balance | Y-o-y changes | Years | Trade balance | Y-o-y changes |
CZK billion | CZK billion | ||||
| 1993 | - 4.5 | 2001 | - 117.4 | 3.4 | |
| 1994 | - 39.5 | - 35.0 | 2002 | - 70.8 | 46.6 |
| 1995 | - 99.6 | - 60.1 | 2003 | - 69.8 | 1.0 |
| 1996 | - 153.0 | - 63.4 | 2004 | - 26.4 | 43.4 |
| 1997 | - 150.5 | 2.5 | 2005 | 38.6 | 65.0 |
| 1998 | - 80.2 | 70.2 | 2006 | 39.8 | 1.2 |
| 1999 | - 64.4 | 15.8 | 2007 | 86.1 | 46.3 |
| 2000 | - 120.8 | - 56.4 | |||
4 China, North Korea, Cuba, Laos, Mongolia and Vietnam
5 Items CZ-CPA15 to CZ-CPA36
6 According to CNB preliminary data from the balance of payments for November 2007 (ECB methodology) published on 18 January 2008
7 In 2004–2006 total FDI inward flows in manufacturing industries stood at CZK 97.6 billion (CNB data) and in January–September 2007 CZK 39.7 billion.
8 Import and export price indices in the Czech Republic are published later than data on the external trade of the CR.
9 See the CZSO World Price Indices of Industrial Raw Materials and Food for December 2007.

