External trade - 4 quarter
Product Code: q-6032-09
External trade 1 in 2009 showed a marked slump for the first time in the history of the Czech Republic 2 . The decrease of exports and namely imports in comparison with 2008 led to y-o-y decrease of the external trade turnover by 16.0% (in 2008 there was an increase by 0.2 % compared with 2007). Thus the value of external trade turnover returned to the level, or became even slightly lower, than in 2006 3 . The external trade balance reached in 2009 the highest surplus 4 (CZK 153.2 billion) since 2005, which was for the first time since the establishment of the Czech Republic, which brought a positive balance 5 that remained characteristic for all coming years. Compared with 2005 the external trade surplus was almost four times higher in 2009 and compared with 2008 it grew more than twice. The y-o-y increase of the positive trade balance value was contributed to (by estimate) by favourable development in terms of trade (CZK +57 billion).
2009 in comparison with 2008:
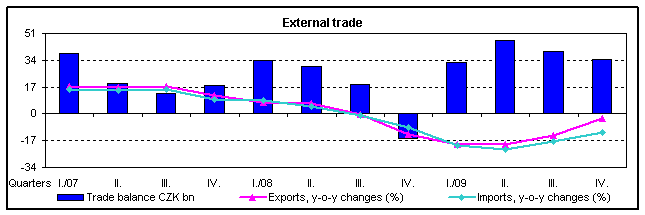
- Exports decreased by 14.1% (CZK 348.6 billion) and reached CZK 2 125.1 billion, imports decreased by 18.1% (CZK 434.5 billion) and reached 1 971.9 billion. In the 4 th quarter the decrease of both exports and imports (-3.0% and -11.5%, respectively) slightly moderated, compared with the three preceding quarters. The y-o-y shrinking by CZK 783.1 billion was by 44.5% due to the decrease of exports and by 55.5% to that of imports. In the year-on year-comparison imports dropped by approximately 14% and exports by 16%. Due to a marked depreciation of CZK against EUR and even more against USD 6 , exports and imports in these currencies decreased in the y-o-y comparison more rapidly than in CZK. Converted in EUR, exports and imports decreased by 18.% and 22.7%, in USD the decrease was 23.2% and 26.6%;
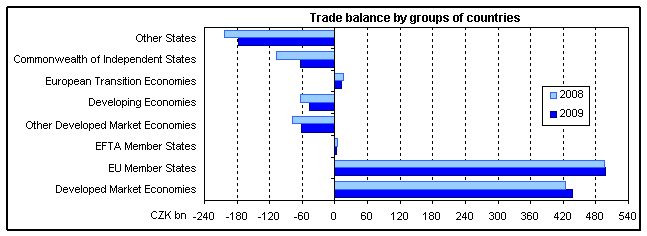
- Trade balance surplus grew by CZK 85.9 billion and reached CZK 153.2 billion. The rate of coverage of imports by exports was 107.8% against 102.8% in 2008. The positive balance reached in the 4 th quarter itself CZK 34.8 billion against CZK 39.3 billion in Q3 and CZK 46.8 billion in Q2 and CZK 32.3 in Q1. By group of countries, the main cause of the trade balance improvement was the y-o-y slightly higher trade balance surplus by CZK 1.9 billion of the external trade with EU countries and especially the y-o-y lower trade balance deficit with non-EU countries by CZK 84.0 billion. The positive balance with EFTA states decreased by CZK 4.5 billion and with the European transition economies by CZK 5.2 billion. The negative balance with CIS 7 countries was lower by CZK 44.4 billion, with other states 8 by CZK 25.2 billion, with other developed market economies by CZK 15.7 billion and with developing economies by CZK 15.2 billion. By commodity section, trade balance surplus improved in manufactured goods classified chiefly by material by CZK 22.6 billion and in miscellaneous manufactured articles by CZK 2.3 billion and deteriorated in machinery and transport equipment by CZK 16.8 billion. A significant moderation of the deficit was registered in the external trade with crude materials, inedible, and mineral fuels by CZK 71.0 billion and chemicals by CZK 10.8 billion, an increase of deficit by CZK 4.0 billion was evident in agricultural and food crude materials and products;
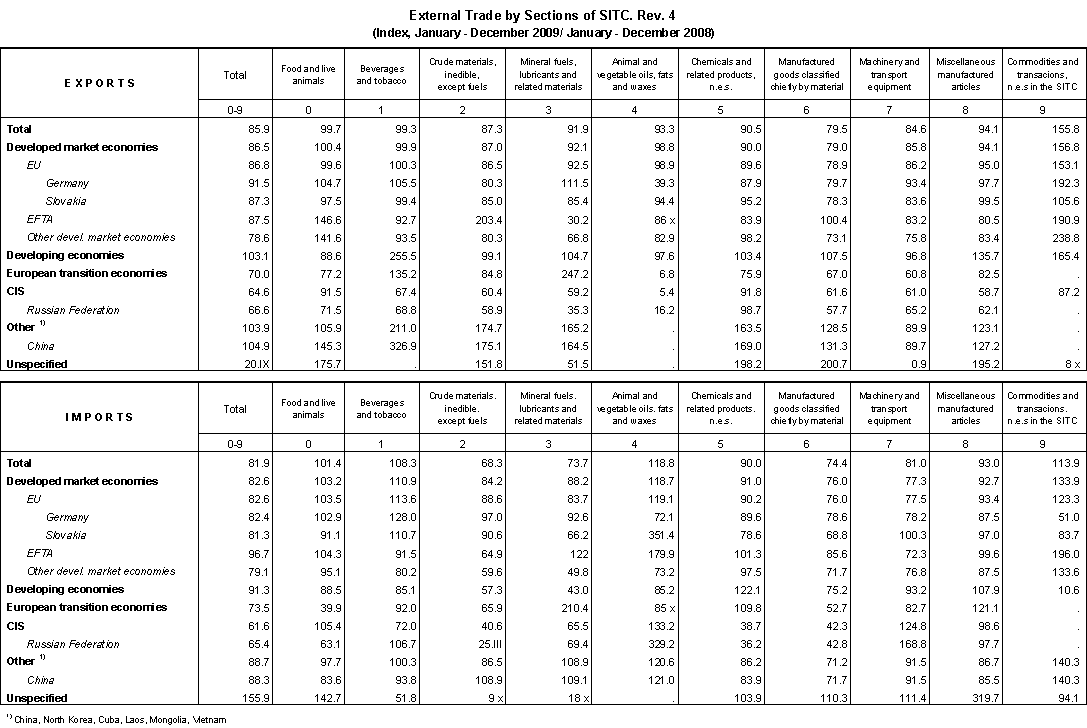
- By group of countries, the share of trade with EU countries in total exports increased (from 85.2% to 86.1%) and also in the total imports from 67.0% to 67.5%. An increase of the in total exports was evident for developing economies (from 3.3% to 4.0%), and for other states (from 0.6% to 0.7%); CIS, European transition economies and the developed market economies weakened their position from 4.3% to 3.2%, from 1.0% to 0.8% and from 3.5% to 3.2%. In total imports, EFTA states resumed the level reached in 2008 (1.9%). In total imports orientation to other states strengthen from 9.0% to 9.8%, developing economies from 6.0% to 6.7% and EFTA states from 1.7% to 2.1%. The share of CIS dropped from 8.9% to 6.7% and the contribution of other developed market economies from 6.8% do 6.6% and that of European transition economies resumed the level of 2008 (0.3%);
- By commodity section, the share of machinery and transport equipment in total exports decreased from 53.8% to 53.0% and the share of manufactured goods classified chiefly by material from 19.5% to 18.1%; an increase of the share was observed in agricultural and food crude materials and products (from 4.0% to 4.6%, in chemical products (from 6.0% to 6.2%), in crude materials, inedible, and mineral fuels (from 6.0% to 6.3%), and in miscellaneous manufactured articles (from 10.7 % to 11.8 %). In the total imports the share of machinery and transport equipment decreased from 41.3% to 40.9%, manufactured goods chiefly classified by material from 19.5% to 18.1% and crude materials, inedible, and mineral fuels from 13.1% to 11.6%. The share increased in agriculture and food crude materials and products from 5.1% to 6,4%, in chemical products from 10.3% to 11.3% and in miscellaneous manufactured articles from 10.5% to 12.0%.
External trade figures for 2009 were affected mainly by:
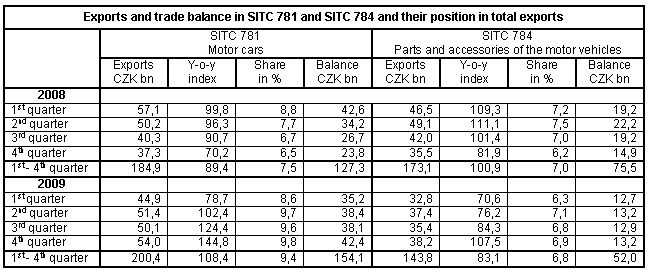
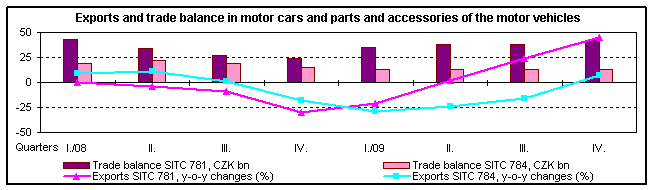
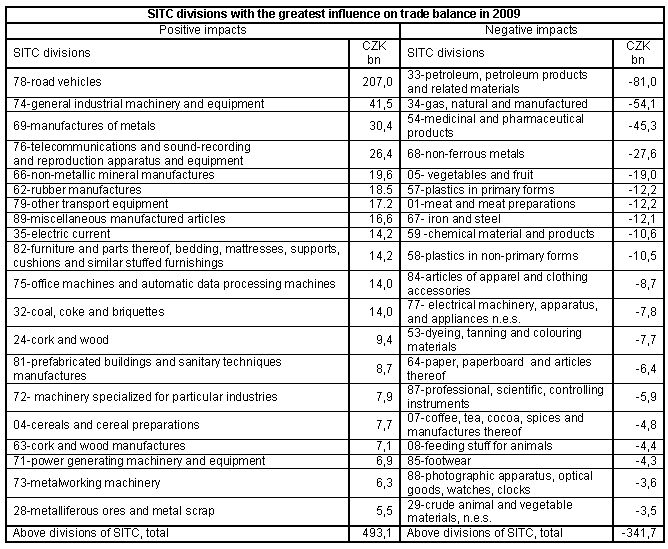
- decrease of industrial production, which affected almost all branches of the manufacturing industry. The two-digit drop of production in these branches had negative influence on total exports. In 2009, compared to 2008, exports of manufacturing industry 9 decreased by 15.0% (CZK 357.3 billion) and its share in total exports decreased to 95.1% from 96.1% in 2008. Exports of manufacturing industry products were dominated by machinery and transport equipment, namely road vehicles, electrical machinery, general industrial machinery and equipment and telecommunications equipment. The share of road vehicles in total exports was 17.3% in 2009 (15.8% in Q1-Q3 2008), of which passenger cars 9.4% and motor vehicles equipment 6.8%. The surplus of external trade with road vehicles (CZK 207.0 billion) in 2009 was the highest among all SITC sections and by CZK 18.8 billion higher in the y-o-y comparison (the increase was CZK 26.8 billion in motor cars and parts and accessories of the motor vehicles the surplus dropped by CZK 23.5 billion).
On the second position in the surplus rank of the machinery trade and simultaneously of the total external trade (CZK 41.5 billion) was observed in general industry machinery and equipment;
- Favourable development of terms of trade 10 . In January to November 2009, compared with the same period of 2008, exports prices increased by 0.6% in the average, prices of imports dropped by 3.5%; so the terms of trade reached the positive value 104.2 and had therefore a positive impact on the external trade balance at current prices. According to preliminary data it can be estimated the for the whole 2009 export prices pushed up exports approximately by CZK 2 billion and import prices pushed down imports by almost CZK 55 billion. Prices pushed the external trade surplus at current prices down by CZK 57 billion;
- Low external demand, caused by the world financial and economic crisis. It was primarily the shrinking of the economies of EU states (by estimate approximately -5%, y-o-y) and the accompanying of the investors and consumer demand, which affected the development of external trade of the Czech Republic in a negative way. The negative impact came mainly from the shrinking of German economy (in 2009 by record figure -5%), which is the key market for Czech enterprises and which in a great extent predestined the development of Czech exports. In 2009, Czech exports to Germany decreased y-o-y by 8.5%;
- Low domestic (consumer’s and investor’s) demand causing decline of import of industrial consumer goods and many engineering products (e.g. machinery equipment for certain industrial branches by 38.5% and metal-working machines by 46.1%).
A more detailed view of the territorial structure of external trade in 2009 shows, that in the y-o-y comparison:
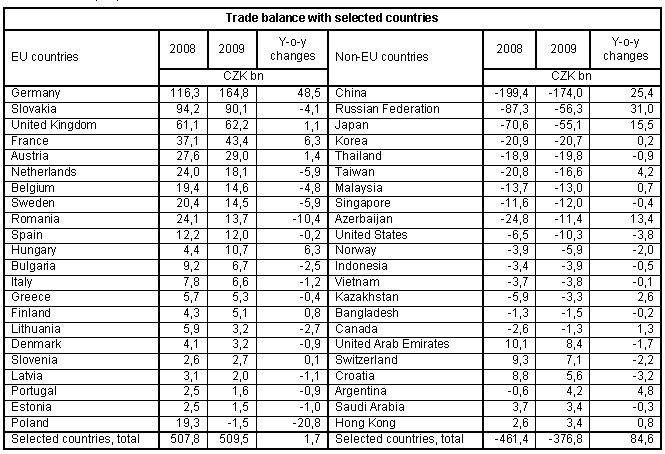
- Exports to all territories, except developing economies, decreased. Exports to EU states decreased by 13.2% (CZK 278.5 billion), exports to non-EU countries by 19.2% (CZK 70.1 billion). The greatest y-o-y relative decrease was observed for exports to CIS and European transition economies, further to other developed market economies and EFTA states. Exports to developing economies and other states increased by 3.9% and 3.1%, respectively. The decrease of exports to EU in total was a result of a decrease to all countries of this group (save for Cyprus and Malta). The largest decrease occurred in exports to Germany (CZK 64.6 billion), to Poland (CZK 34.2 billion), to Slovakia (CZK 29.0 billion) and Italy (CZK 21.3 billion). Among non-EU countries we can name a marked decrease of exports to Russia (CZK 22.5 billion), to Ukraine (CZK 11.7 billion) and to the US (CZK 11.5 billion). Exports to Turkey increased by CZK 0.5 billion and to China by CZK 0.6 billion;
- Imports from all territories decreased. Imports from EU states decreased by 17.4% (CZK 280.4 billion) and from non-EU countries by 19.4% (CZK 154.1 billion). The most marked relative decrease was observed at imports from CIS and European transition economies, further from other developed market economies, other states, developing economies and EFTA states. The decrease of total imports from EU was due to a decrease of imports from all EU countries except Malta, Latvia, Cyprus and Portugal. Perceivable was the shrinking in imports from Germany (CZK 113.1 billion) and Slovakia (CZK 24.9 billion), Hungary (21.3 billion), France (21.0 billion) and Italy (CZK 20.1 billion). Among non-EU countries imports decreased namely from Russia (CZK 53.5 billion), China (CZK 24.8 billion, Japan (CZK 18.5 billion) and from Azerbaijan (CZK 13.5 billion). Slight increase was reported for imports from Norway (CZK 1.4 billion);
- External trade surplus was higher. Positive trade balance with EU states reached CZK 498.5 billion, deficit with non-EU countries was CZK 345.3 caused by a negative balance with other states (CZK 177.6 billion), CIS (CZK 62.9 billion), other developed market economies (CZK 61.7 billion) and developing economies (CZK 47.7 billion). European transition economies and EFTA states softened down the total trade balance with non-EU countries by the surplus of CZK 11.2 billion and 0.3 billion.
Trade balance and its y-o-y changes for particular groups of countries were due to the development of the trade balance with partner states. The total external trade surplus with EU states in 2009 was namely affected (CZK 389.5 billion compared to CZK 336.3 billion in 2008) by the positive balance with five states (Germany, Slovakia, the United Kingdom, France and Austria). Within the total deficit of the balance with non-EU countries, CZK 285.4 billion against CZK 357.3 billion in 2008) fell on three states (China, Russia and Japan).
Changes in commodity structure of the external trade showed in 2009, compared to 2008, a decrease of both exports and imports in an overwhelming majority of SITC sections. Compared to 2008, following changes were observed in 2009:
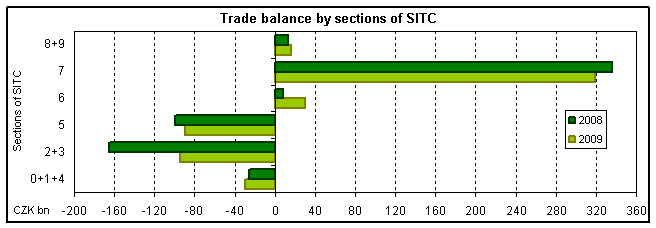
- Machinery and transport equipment a shrinking of exports by 15.4% (CZK 205.4 billion and imports by 19.0% (CZK 188.6 billion). The decrease of the value of exports and imports was the highest among all SITC sections and brought a marked affection of the overall shrinking of external trade. The positive balance of external trade with machinery and transport equipment reached CZK 319.4 billion against CZK 336.2 billion in 2008 (with EU states CZK 463.7 billion against CZK 472.3 billion). Surplus of trade balance was registered, except electrical equipment (whose balance ended with a deficit of CZK 7.8 billion against a surplus CZK 16.8 billion in 2008) for all other machinery groups. The highest active balance was evident for road vehicles, then for manufacture of machinery and equipment, telecommunications and sound-recording and reproduction apparatus and equipment, office machines and automatic data-processing machinery and other transport equipment;
- Manufactured goods classified chiefly by material showed a decrease of exports by 20.5% and imports by 25.6%. The positive balance of these products reached CZK 30.6 billion from CZK 8.0 billion in 2008. The improvement of trade balance was due primarily to a lower deficit in trade with non-ferrous metals by CZK 15.0 billion and with iron and steel by CZK 15.4 billion. The largest surpluses are to be found in the trade with metallic manufactures, non-metallic manufactures and rubber manufactures;
- Miscellaneous manufactured articles registered a decrease of exports by 5.6% and imports by 6.8% and an increase of the external trade surplus by CZK 2.3 billion. A positive balance was observed in miscellaneous manufactured articles, furniture and parts thereof, prefabricated buildings and sanitary. Deficit shrank in professional, scientific and controlling instruments, in footwear and articles of apparel and clothing accessories;
- Chemicals and related products showed lower exports by 9.5% and imports by 10.1%. The negative balance of this trade was the second highest (CZK 89.0 billion against CZK 99.8 billion in 2008) among all SITC sections. A big deficit concentrated to medicinal and pharmaceutical products; its y-o-y increase was CZK 5.0 billion. The deficit decreased in plastics in primary forms by CZK 4.7 billion, in fertilizers by CZK 3.5 billion, chemical materials and products by CZK 3.6 billion and plastics in non-primary forms by CZK .9 billion;
- Crude materials, inedible, and mineral fuels, shrinking of exports by 10.1% and namely of imports by 27.4%. Trade deficit decreased by CZK 71.0 billion, y-o-y, and was the highest (CZK 94.4) billion among all SITC sections. This decrease was the result of the decrease of the deficit of trade in petroleum, petroleum products and related materials by CZK 43.6 billion. Imports in this item were y-o-y lower by 36.3% (imports of petroleum themselves decreased by 8.5% in volume and by 41.2% in value). The balance of trade in crude materials, inedible, and mineral fuels was positively affected by shrinking of deficit of trade in gas, natural and manufactured by 10.4% (imports of natural gas themselves increased by 1.0% in volume and decreased by 14.3% in value). A positive influence had the increase of surplus of the trade in electric current by 8.7%, turning deficit of CZK 3.2 billion into surplus of CZK 5.5 billion in metalliferous ores and metal scrap and a lasting surplus in trade with cork and wood manufactures; negative influence came from decrease of surplus in trade with coal, coke and briquettes by CZK 3.8 billion;
- Agricultural and food crude materials and products, decrease of exports by 0.6% and, as the only SITC class, growth of imports by 2.8%. Deficit of balance of trade in these products was y-o-y higher by CZK 4.0 billion. The highest deficit brought the trade in vegetables and fruit and meat and meat preparations and with coffee, tea, cocoa, spices, and manufactures thereof. The surplus of trade with cereals and cereal preparations grew by CZK 2.3 billion and decreased in trade with tobacco and tobacco manufactures by CZK 1.0 billion and decreased by CZK 1.9 billion in dairy products and birds´ eggs.
| Sections of SITC, Rev. 4 | Sections of SITC, Rev. 4 | ||
| 0+1+4 | Agricultural and food crude materials and products | 6 | Manufactured goods classified chiefly by material |
| 2+3 | Crude materials, inedible, and mineral fuels | 7 | Machinery and transport equipment |
| 5 | Chemicals and related products | 8+9 | Miscellaneous manufactured articles, commodities and transactions not classified elsewhere in the SITC |
o - o - o
On January 15, 2009, Eurostat published data on external trade of EU countries for January to October 2009. All EU states registered a double digit decrease of external trade, compared to the same period of 2008. The y-o-y decrease of exports of the Czech Republic was, compared to the decrease of the EU total and new member states total rather higher, the y-o-y decrease of imports was in relation to the EU total more marked and in relation to the total of new member states more moderate. In January to October 2009, exports of EU (in EUR) is decreased y-o-y by 21.2% and imports by 23.5% in average and imports of these countries decreased by 29.2% on average. The share of 12 new EU member states in total EU exports in January to October 2009 slightly weakened to 11.1% from 11.2% in January to October 2008 and in total EU exports the share of these stated dropped in January to October 2009 to 11.6% compared to 12.5% in the corresponding period in 2008. The EU trade balance ended in January to October 2009 with a deficit of EUR 28.9 billion against the deficit of EUR 141.9 billion in January to October 2008 and the deficit of 12 new member states reached EUR 17.0 billion, which was, y-o-y, by EUR 48.4 billion lower. The Czech Republic reached (as well as other 10 EU states) a trade balance surplus in January to August 2009. Among new member states, a surplus was reached also in Hungary (EUR 3.8 billion), Slovakia (EUR 0.6 billion) and Slovenia (EUR 0.1 billion).
1 All data are in current prices. Data for year 2008 are finalized and refer to 28 August 2009 closing date. Data for 2009 are updated for January-September and preliminary for October referring to 30 November 2009, data for November are preliminary referring to 30 December 2009 and for December preliminary referring to 29 January 2010. The data come from basic units and then rounded, which may give rise to discrepancies.
2 Another, much more moderate decrease of external trade turnover, by 2.8% compared with the preceding year (exports decreased by 1.0%, imports by 4.3%), occurred in 2002.
3 In 2006 the external trade turnover reached CZK 4 249.4 billion (CZK exports 2 144.6 billion and imports CZK 2 104.8 billion).
4 In 2008, the positive balance amounted to CZK 67.2 billion.
5 In 2005 the surplus of the trade balance reached CZK 38.6 billion.
6 In January -December 2009 compared to January-December 2008, CZK weakened by 5.7% on average against EUR and by 10.6% on average against USD.
7 The Commonwealth of Independent States.
8 China, North Korea, Laos, Mongolia and Vietnam.
9 Items CZ-CPA 15 to CZ-CPA 36.
10 Price indices of exports and imports are published one month later than data on external trade of the Czech Republic.