External trade - 3. quarter of 2008
Product Code: e-6032-08
In comparison to Q1–Q3 2007, external trade 1 showed markedly lower growth rates in Q1–Q3 2008. The growth rates of exports and imports have been at the lowest level since the Czech Republic joined the European Union. External trade turnover rose by 3.7% (+16.2% in Q1–Q3 2007). Exports grew by 0.8 p.p. more year-on-year than imports. The trade balance reached the highest surplus (CZK 87.2 billion) ever recorded in the Czech Republic.
In Q1–Q3 2008, compared to Q1–Q3 2007:
- exports increased by 4.1% and reached CZK 1 895.9 billion, imports grew by 3.3% and reached CZK 1 808.6 billion. However, the growth rate was gradually decreasing, and stagnating exports and decreasing imports were observed in Q3. Increases in exports and imports accounted for 56.5% and 43.5% respectively of the year-on-year growth of external trade turnover by CZK 132.0 billion. Due to marked appreciation of CZK against EUR and even more against USD, exports and imports in EUR and USD grew more rapidly – exports and imports in EUR by 17.7% and 16.8% respectively, exports and imports in USD by 33.3% and 32.0% respectively;
- trade balance surplus grew by CZK 17.2 billion and reached CZK 87.2 billion (the rate of coverage of imports by exports was 104.8% in comparison to 104.0% in Q1–Q3 2007). By group of countries, trade surplus with EU27 states rose by CZK 77.8 billion and trade deficit with non-EU27 countries increased by CZK 60.6 billion. Surplus with the European transition economies decreased by CZK 2.5 billion and with EFTA states by CZK 0.5 billion. Trade deficit deteriorated with the CIS 2 countries by CZK 22.2 billion, with other states 3 by CZK 20.0 billion, with other developed market economies by CZK 9.3 billion and with developing economies by CZK 8.1 billion. By commodity section, trade balance improved due to a CZK 37.1 billion increase of surplus in ‘machinery and transport equipment’, a CZK 8.8 billion increase of surplus in ‘manufactured goods classified chiefly by material’ and a CZK 8.3 billion decrease of deficit in ‘agricultural and food crude materials and products‘. Trade balance deteriorated due to a CZK 7.2 billion decrease of surplus in ‘miscellaneous manufactured articles’ and a CZK 1.7 billion increase of deficit in ‘chemicals and related products’, and especially due to a 28.2 CZK billion increase of deficit in ‘crude materials, inedible, and mineral fuels’;
- by group of countries, the share of EU27 states in total exports slightly decreased (from 85.5% to 85.4%), and in total imports dropped more (from 71.2% to 68.2%). Higher share in total exports was registered only for CIS countries, while the shares of the remaining groups of countries decreased (other developed market economies, developing economies) or did not change (other states). In total imports the shares of CIS countries, other states, developing economies and European transition economies increased, the shares of other developed market economies and EFTA states remained at the level of Q1–Q3 2007;
- by commodity section, the share of ‘machinery and transport equipment’ in total exports rose (from 53.5% to 53.7%) to the detriment of ‘manufactured goods classified chiefly by material’ and ‘miscellaneous manufactured articles’, the share of ‘agricultural and food crude materials and products‘ and ‘crude materials, inedible, and mineral fuels’ increased. The share of ‘machinery and transport equipment’ in total imports decreased (from 42.1% to 41.1%). In total imports, the share of ‘crude materials, inedible, and mineral fuels‘ grew, the share of ‘manufactured goods classified chiefly by material’ decreased and the share of ‘chemicals and related products’ remained (just like in exports) at the level of Q1–Q3 2007.
Data released by Eurostat on 17 October 2008 for all EU27 member states covering January–July 2008 show that external trade of the Czech Republic grew better in comparison to external trade of EU27 states and external trade of the new EU member states. EU27 (EU15) exports rose by 7.2% (6.0%) and EU27 (EU15) imports by 8.3% (7.2%) on average year-on-year (in EUR). Exports and imports of the twelve new member states grew by 18.1% and 17.3% respectively on average year-on-year. In January–July 2008 the share of the twelve new member states in total EU27 exports increased to 11.0% (from 10.0% in January–July 2007) and their share in total EU27 imports grew to 12.3% (from 11.4% in January–July 2007). The EU27 trade balance reached a EUR 80.5 billion deficit in January–July 2008 (EU15 deficit was EUR 38.9 billion and the twelve new member states’ deficit was EUR 41.6 billion). The Czech Republic was among the ten EU27 member states and one of the two (along with Hungary) new EU member states which recorded a trade surplus in January–July 2008.
External trade figures for Q1–Q3 2008 were affected by:
- unfavourable terms of trade 4 . External trade prices were affected by prices in the world market and sharp appreciation of CZK against EUR and USD. In January–August 2008, in comparison to January–August 2007, export and import prices were down by 5.8% and 4.1% respectively on average. Terms of trade reached 98.2. In the same period exports and imports increased by 4.0% and 2.8% respectively at current prices, but by 10.9% and 8.1% respectively at constant prices. In January–August 2008 the prices reduced current price exports by over CZK 112 billion and current price imports by about CZK 82 billion. External trade surplus at constant prices was by nearly CZK 30 billion higher than external trade surplus at current prices. In January–September 2008, compared to January–September 2007, CZK strengthened by 13.1% against EUR on average and by 28.0% against USD on average;
- weakening external demand due to global economic slowdown, EU countries are no exception. The EU economic growth came to a halt already in Q2 2008 because GDP increased by 1.7% 5 year-on-year, as against 2.3% in Q1. In Q3 2008 the slowdown was even more marked. Some of the EU27 states reported year-on-year GDP decreases. Global economic situation deteriorated as a result of continuing financial market instability, the strong euro, economic recession in the US and increased inflationary pressures due to the growth of commodity world prices 6 (petroleum, natural gas and food in particular). Economic development in two main trading partners – Germany and Slovakia – is decisive for external trade of the Czech Republic. Germany was the destination for 30.8% and Slovakia for 9.0% of the Czech Republic’s total exports in Q1–Q3 2008 (as against 31.1% and 8.5% respectively in Q1–Q3 2007). Exports to Germany grew by 3.1% (CZK +17.6 billion) and to Slovakia by 9.4% (CZK +14.6 billion) year-on-year;
- a more moderate growth of industrial production. In January–August 2008 the y-o-y industrial production index reached 105.0 (of which in manufacturing 105.4). Above-the-average year-on-year increases were recorded in ‘manufacture of electrical and optical equipment’ (+19.2%), ‘manufacture of machinery and equipment’ (+8.2%), ‘manufacture of chemicals, chemical products and man-made fibres’ (+7.7%) and ‘manufacture of transport equipment’ (+7.6%). Especially increases in these manufacturing industries 7 had a favourable effect on the growth of exports. Manufacturing exports made up 96.4% of total exports in Q1–Q3 2008. In comparison to Q1–Q3 2007, manufacturing exports grew by 4.2% (CZK +74.5 billion).
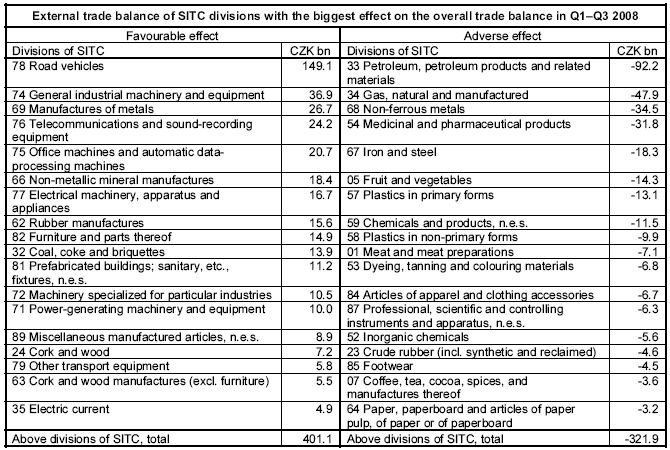
The most important section of manufacturing exports in Q1–Q3 2008 remained ‘machinery and transport equipment’, especially ‘road vehicles’, ‘electrical machinery, apparatus and appliances, n.e.s.’, ‘general industrial machinery and equipment’, ‘office machines and automatic data-processing machines’ and ‘telecommunications equipment n.e.s.’. Exports of ‘road vehicles’ made up 16.2% of total exports in Q1–Q3 2008 (16.8% in Q1–Q3 2007), of which exports of passenger cars 7.7% (8.4% in Q1–Q3 2007) and exports of ‘parts and accessories for motor vehicles’ 7.1% (7.0% in Q1–Q3 2007). While external trade in road vehicles produced the highest surplus among all SITC classes, the surplus was down by CZK 4.0 billion compared to Q1–Q3 2007 (surplus in passenger cars fell by CZK 10.2 billion to CZK 102.8 billion and surplus in ‘parts and accessories for motor vehicles’ grew by CZK 6.2 billion to CZK 58.3 billion). The second largest surplus in machinery trade (CZK +7.0 billion year-on-year) and in total external trade as well was registered for ‘general industrial machinery and equipment’.
A closer look at external trade by group of countries in Q1–Q3 2008 shows that, in comparison to Q1–Q3 2007:
- exports to EU27 states, CIS countries and other states grew, whereas exports to the remaining group of countries (developing economies, EFTA states, European transition economies and especially other developed market economies) decreased. A highly above-the-average growth of 21.4% (CZK +14.0 billion) was observed in exports to CIS countries (mainly the Russian Federation). Exports to EU27 states rose by 4.1% (CZK +63.5 billion). Increase in exports to EU27 states made up 85.1% of total exports increase. Exports to EU27 states reflected different growth rates of exports to individual EU27 member states. Exports to eleven EU27 member states (e.g. to Poland, Slovakia, the Netherlands, Austria and Romania) increased more than the average; below-the-average increases were registered in exports to Germany, France and Italy; exports to twelve EU27 states (e.g. to Spain, Hungary and the United Kingdom) decreased. The highest year-on-year increases were registered for exports to Germany (CZK +17.6 billion), Poland (CZK +14.9 billion), Slovakia (CZK +14.6 billion), the Netherlands (CZK +6.7 billion), Austria (CZK +6.1 billion) and Romania (CZK +5.8 billion). Increase in exports to these states made up 88.1% of total exports increase;
- imports from all groups of countries increased, except imports from EU27 states and EFTA states. Highly above-the-average increases were recorded in imports from European transition economies, CIS countries (the Russian Federation) and other states (China). Above-the-average percentage growth was registered for imports from developing economies and other developed market economies. Increase in imports from non-EU27 countries reached CZK 71.7 billion. Imports from EU27 states dropped by 1.1% (CZK ‑14.3billion). Imports from five EU27 states (e.g. from Slovakia and Poland) grew more than the average; imports from four EU27 states (e.g. from Austria, Germany and Belgium) rose less than the average; imports from 17 EU27 states (e.g.. from the Netherlands, France, Italy and the United Kingdom) decreased year-on-year. The highest year-on-year increases in imports were recorded for imports from Slovakia (CZK +8.1 billion) and Poland (CZK +6.7 billion);
- external trade surplus grew by CZK 17.2 billion. Trade surplus with EU27 states reached CZK 387.0 billion, trade deficit with non-EU27 states CZK 299.8 billion. The latter was due to the trade deficit with other states (CZK 141.5 billion), CIS countries (CZK 78.3 billion), developing economies (CZK 44.5 billion) and other developed market economies (CZK 56.1 billion).
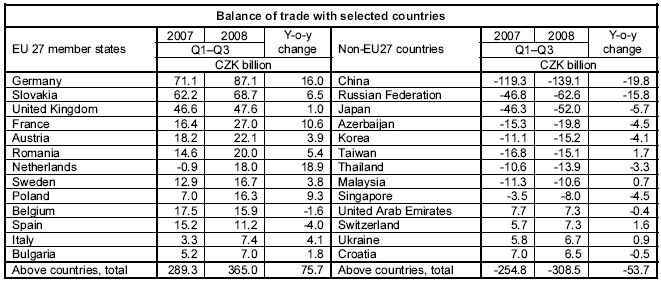
The trade balance and year-on-year balance increases/decreases (y-o-y changes) with individual groups of countries reflected the situation of external trade balance with the main partner states, as documented by the table below. External trade with 13 EU27 states reached a surplus of CZK 289.3 billion, of which trade surplus with three EU27 states (Germany, Slovakia and the United Kingdom) accounted for 55.7%. Trade balance with 13 non-EU27 states reached a deficit of CZK 308.5 billion, of which trade deficit with three states (China, the Russian Federation and Japan) made up CZK 253.7 billion.
Commodity structure of external trade in Q1–Q3 2008, in comparison to Q1–Q3 2007, showed lower export and import growth rates in overwhelming majority of SITC sections. In Q1–Q3 2008, in comparison to Q1–Q3 2007, external trade was characterised in:
- machinery and transport equipment by slightly above-the-average growth of exports and stagnating imports. The share of ‘machinery and transport equipment’ in total exports and imports moderately grew and dropped respectively. Higher exports (imports) of ‘machinery and transport equipment’ by CZK 42.2 billion (by CZK 5.0 billion) accounted for 56.6% (nearly 9%) of increase in total exports (total imports). Trade surplus in ‘machinery and transport equipment’ reached CZK 274.8 billion (machinery exports covered 37.0% of machinery imports); the surplus with EU27 stood at CZK 364.4 billion. The highest surplus was produced in trade in ‘road vehicles’, followed by ‘general industrial machinery and equipment’, ‘telecommunications and sound-recording equipment’, ‘office machines and automatic data-processing machines’, ‘electrical machinery, apparatus and appliances, n.e.s.’ and ‘machinery specialized for particular industries’. The above commodity divisions reached the total external trade surplus of CZK 258.2 billion, of which the trade surplus with EU27 states was CZK 356.2 billion;
- manufactured goods classified chiefly by material by stagnating exports and decreasing imports. The share of these goods in total exports and especially in total imports decreased (from 20.8% to 20.0% and from 21.6% to 20.4% respectively). The slight deficit in these goods in Q1–Q3 2007 turned to a surplus in Q1–Q3 2008. This improvement was due to deficit decreases in ‘non-ferrous metals’ by CZK 6.7 billion and ‘iron and steel’ by CZK 4.5 billion. The highest surpluses were reached in ‘manufactures of metals’, ‘non-metallic mineral manufactures’ and ‘rubber manufactures, n.e.s.’; CZK 60.7 billion in total;
- miscellaneous manufactured articles, commodities and transactions not classified elsewhere in the SITC by below-the-average growth of exports and above-the-average growth of imports, which resulted in a fall of surplus by CZK 7.1 billion and decrease of the share in total exports and increase in total imports. Trade surplus rose insignificantly in ‘prefabricated buildings, sanitary, plumbing, heating and lighting fixtures and fittings, n.e.s.’ and decreased in ‘furniture and parts thereof’. Trade deficit deteriorated in ‘professional, scientific and controlling instruments and apparatus, n.e.s.‘, ‘articles of apparel and clothing accessories’ and ‘footwear’;
- chemicals and related products by below-the-average increase of exports and imports and thus by stagnation of their shares in total exports (6.0%) and total imports (10.6%). The trade deficit was the second highest (CZK 78.0 billion) and rose by CZK 1.7 billion. A large deficit remained in ‘medicinal and pharmaceutical products’ (CZK 31.8 billion). Trade deficits in ‘plastics in primary forms’ and ‘plastics in non-primary forms’ decreased by CZK 1.8 billion and CZK 2.9 billion respectively year-on-year and trade deficit in ‘chemical materials and products, n.e.s.’ deteriorated;
- crude materials, inedible, and mineral fuels by the highest percentage growth of exports and even more of imports, which contributed to a year-on-year increase in the share of these products in total exports and total imports. The trade deficit grew by CZK 28.2 billion year-on-year and remained the highest among all SITC sections (CZK 116.1 billion). The deficit deteriorated due to higher deficit in trade in ‘petroleum, petroleum products and related materials’ by CZK 12.7 billion and ‘gas, natural and manufactured’ by CZK 13.8 billion. Imports of these commodity items grew by 22.5% and 43.5% respectively year-on-year (petroleum imports dropped by 2.5% in volume and increased by 28.0% in value; natural gas imports rose by 26.1% in volume and by 45.0% in value. The balance of trade in crude materials, inedible, and mineral fuels was affected by increase in trade surplus in ‘coal, coke and briquettes’ by CZK 4.6 billion and by decreases in trade surplus in ‘electric current’ by CZK 6.5 billion and ‘cork and wood’ by CZK 1.9 billion;
- agricultural and food crude materials and products by highly above-the-average increase of exports and stagnating imports. The trade deficit fell by CZK 8.3 billion. Trade deficit in ‘vegetables and fruit’ decreased by CZK 1.0 billion, trade surplus in ‘cereals and cereal preparations’ rose by CZK 1.4 billion and trade balance of ‘tobacco and tobacco manufactures’ turned from the CZK 0.9 billion deficit to a CZK 2.7 billion surplus.
| Sections of SITC, Rev. 4 | Sections of SITC, Rev. 4 | ||
| 0+1+4 | Agricultural and food crude materials and products | 6 | Manufactured goods classified chiefly by material |
| 2+3 | Crude materials, inedible, and mineral fuels | 7 | Machinery and transport equipment |
| 5 | Chemicals and related products | 8+9 | Miscellaneous manufactured articles, commodities and transactions not classified elsewhere in the SITC |
1 All data are at current prices. Data for January–December 2007 are finalised and refer to 28 August 2008 closing date. Data for January–June 2008 are updated referring to 28 August 2008, data for July 2008 preliminary referring to 28 August 2008, data for August 2008 are preliminary referring to 26 September 2008 and data for September 2008 are preliminary referring to 29 October 2008. The data come from basic units and then rounded, which may give rise to discrepancies.
2 The Commonwealth of Independent States.
3 China, North Korea, Cuba, Laos, Mongolia and Vietnam.
4 Import and export price indices in the Czech Republic are published later than data on the external trade of the CR.
5 Second estimate by Eurostat of 8 October 2008.
6 In Q1–Q3 2008, in comparison to Q1–Q3 2007, the world prices of industrial raw materials and food grew by 51.8% in total; for example, world prices of crude oil Brent by 67.0%, natural gas by 52.2% and food and oils by 39.5% – see CZSO World Price Indices of Industrial Raw Materials and Food for September 2008.
7 Items CZ-CPA15 to CZ-CPA36.