Development of the industry - 3. quarter of 2007
Product Code: e-8019-07
Development of industry in the third quarter of 2007: analysis
Development of industry in the Q3 2007 was dynamic as for all indicators. Growing was: production, employment, labour productivity as well as volumes of new orders, compared to the corresponding period of the previous year. However, compared with the first two quarters of 2007 the growth rate of all these indicators was slower. The main factors of high industrial growth were:
- growth at new production capacities, especially of foreign investors (mainly electrical engineering industry and industry of transport equipment and production of rubber and plastic products),
- strong external demand
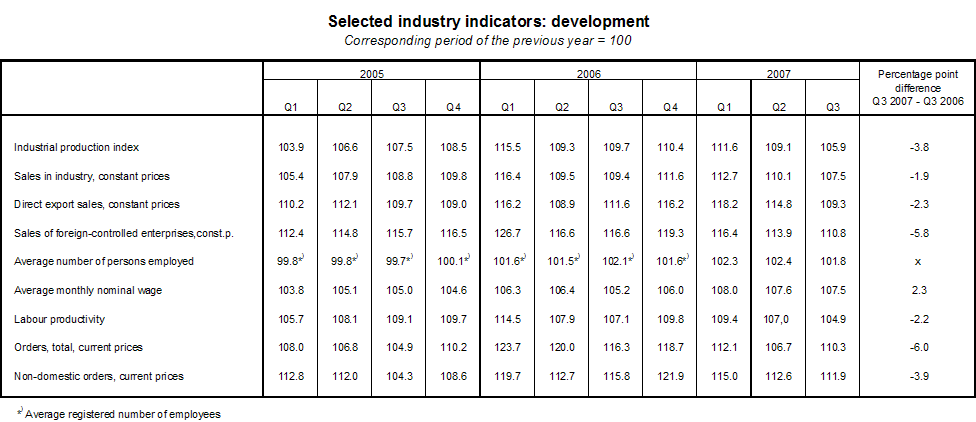
Industrial production
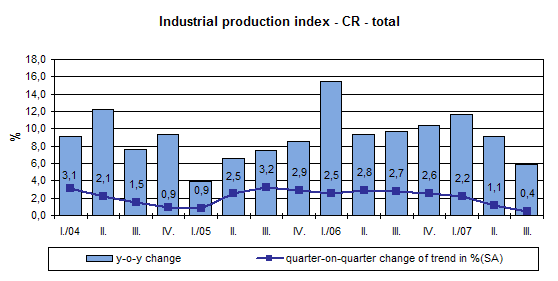
Industrial growth in total and its dynamics
The year-on-year industrial production index in Q3 2007 reached 105.9% ( 108.9% in Q1 to Q3 2007), and 106.2%, seasonally adjusted (108.7% in Q1 to Q3 2007). Compared to the y-o-y production growth in Q2 2007 (index 109.1%) the total growth of industrial production dropped.
Development of individual branches and main industrial groupings
The following contributed most to the growth of industrial production: ‘ manufacture of transport equipment' (its contribution to the industrial growth in total was 2.3 percentage points, the branch grew by 12.0%), ‘manufacture of electrical and optical equipment‘ (contribution of 2.1 p.p., the branch grew by 14.9%) and ‘manufacture of machinery and equipment‘ (contribution of 1.1 p.p., growth by 16.4%). Industrial production decreased in ‘ manufacture of coke and refined petroleum products‘ (contribution of -0.8 p.p., decrease by 17.7%), ‘manufacture of basic metals and fabricated metal products‘ (contribution -0.5p.p., decrease by 3.9%) and ‘mining and quarrying of energy producing materials‘ (contribution -0.1%, decrease by 5.7%).
In Q3 2007, industrial production increased in all leading industrial groupings: capital goods (13.7%), consumer durables ( 10.7 %), intermediate goods ( 4.2%), consumer non-durables (1.2%) In the leading industrial grouping a drop was recorded for power production (6.1%).
Sales
Growth and dynamics
In Q3 2007, sales in the industry were higher by 7.5% year-on-year at constant prices, ( in Q1 to Q3 2007 by 10.2%) and seasonally adjusted by 7.9%. At current prices the sales rose y-o-y by 9.7% (in Q1 to Q3 by 12.4%).
The following contributed most to the growth of sales in industry: ‘manufacture of transport equipment' (contribution to the industrial growth in total was 2.4 percentage points, the branch grew by 12.0%), ‘manufacture of electrical and optical equipment‘ (contribution of 2.1 p.p., growth by 13.2%), and ‘manufacture of machinery and equipment‘ (contribution of 1.4 p.p., growth by 16.3%). Sales in industry decreased in ‘ manufacture of coke and refined petroleum products‘ (contribution -0.4 p.p., decrease by 18.1%), ‘manufacture of basic metals and fabricated metal products‘ (contribution -0.1 p.p., decrease by 1.1%) and 'mining and quarrying of energy producing materials‘ (contribution -0.1 p.p., drop by 5.2%).
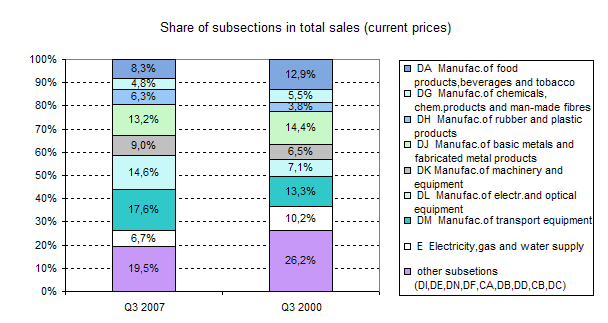
Changes in structure due to sales
In Q3 2007, from among individual subsections the highest share was attributed to ‘ manufacture of transport equipment‘ (17.6% in sales in industry for the branch in total), ‘manufacture of electrical and optical equipment‘ (14.6%) and ‘manufacture of basic metals and fabricated metal products‘ (13.2%). Compared to Q3 2006, no significant movements were recorded in the structure of sales in industry. Hence, the below graph shows comparison of structures in longer interval, which, in addition, documents the growing significance of car industry and ‘manufacture of electrical and optical equipment‘.
Direct export sales and sales of foreign-controlled enterprises
Direct export sales of industrial enterprises grew in Q3 2007 faster than sales in industry in total - by 9.3% at constant prices (by 14.1% in Q1 to Q3 2007), and by 11.1% at current prices (by 15.9% in Q1 to Q3 2007). Their share in total sales of industrial enterprises made 49.3% and compared to Q3 2006 it increased (from 48.7%). The biggest growth at constant prices by volume of sales was recorded in ‘manufacture of transport equipment‘ (by 13.1%), ‘manufacture of electrical and optical equipment‘ (by 5.4%), ‘manufacture of machinery and equipment‘ (by 21.3%).
Sales in industry implemented by foreign-controlled enterprises recorded a growth, too. They rose by 10.8% (at constant prices) and by 12.6% (at current prices). Their share in total sales at current prices stood at 60.0 % while compared with Q3 2006, it grew (from 58.4%). 61.6% of sales of foreign-controlled enterprises were fed to direct exports.
Employment, wages and labour productivity
Employment
In Q3 2007, employment in industry increased, year-on year, by 21.3 thousand persons, i.e. by 1.8% (in Q1 to Q3 2007 it stood at 102.2%). The average number of employees in industry was 1,176 thousand persons.
Employment increased most in the following industries: ‘ manufacture of rubber and plastic products‘ (+8.2%), ‘manufacture of machinery and equipment‘ (+5.5%) and ‘manufacture of transport equipment‘ (+4.6%) and employment dropped most in: ‘manufacture of textiles and textile products‘ (-9.0%), 'manufacture of leather and leather products (-8.3%) and ‘mining and quarrying of energy producing materials‘ (-5.9%).
Foreign-controlled enterprises employed 527.9 thousand persons, i.e. 44.9 % of the total number of employees in industry: Their percentage increased compared to Q3 2006 when it stood at 41.8%.
Besides the above number 44.1 thousand persons working in industrial organizations were employed by public employment offices and other companies, (y-o-y growth by 22.8%) mostly in the following branches: ‘manufacture of transport equipment‘ (11.0 thousand persons, growth by 21.0%), ‘manufacture of electrical and optical equipment‘ (10.9 thousand persons, growth by 16.2%) and ‘manufacture of machinery and equipment‘ (6.5 thousand persons, growth by 39.5%).
Wages
In Q3 2007, average monthly wage in industry reached CZK 20,647 and was 7.5% up, y-o-y (in Q1 to Q3 it stood at 107.7%).The highest level of wages was recorded for: ‘ manufacture of coke and refined petroleum products‘ (CZK 27,577), ‘electricity, gas and water supply‘ (CZK 26,693) and ‘mining and quarrying of energy producing materials‘ (CZK 23,892). The lowest level of wages was in: ‘manufacture of leather and leather products‘ (CZK 13,113), ‘manufacture of textiles and textile products‘ (CZK 14,071) and ‘manufacturing N.E.C.‘ (CZK 16,721). The most significant growth was recorded for ‘manufacture of basic metals and fabricated metal products‘ (by 9.5%, to CZK 20,853), ‘electricity, gas and water supply‘ (by 8.9%, to CZK 26,693) and 'manufacture of other non-metallic mineral products' (by 8.8%, to CZK 21,521).
Average wage in foreign-controlled enterprises was CZK 22,589, i.e. 9.4% more than average wage in the industry in total. It grew, year-on-year, by 6.5 %.
Labour productivity
In Q3 2007, labour productivity in industry increased by 4.9%.
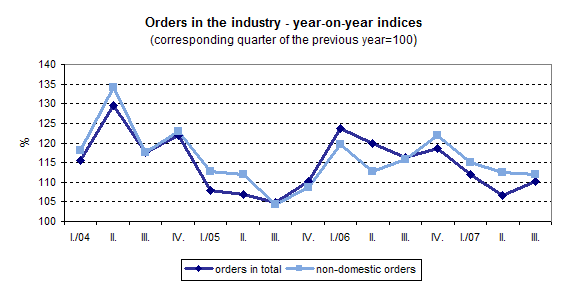
New orders
New orders (total)
In Q3 2007, new orders were signed in selected industries and their volume increased by 10.3%. The growth was most contributed to by: ‘manufacture of machinery and equipment‘ (contribution of 4.2 p.p., growth by 33.0%), ‘manufacture of motor vehicles, trailers and semi-trailers‘ (contribution of 3.2 p.p., growth by 12.1%) and ‘manufacture of electrical machinery and apparatus‘ (contribution of 2.0 p.p., growth by 21.1%). Drop of new orders was recorded for ‘manufacture of basic metals and fabricated metal products‘ (contribution –0.4 p.p., drop by 3.0%), ‘manufacture of radio, television and communication equipment and apparatus‘ (contribution -0.4 p.p., drop by 6.0%) and 'manufacture of fabricated metal products' (contribution by -0.1 p.p., drop by 1.1%).
New non-domestic orders
In Q3 2007, new non-domestic orders signed in selected industries increased, y-o-y, by 11.9%. Increases in the volume of new non-domestic orders were ascertained in: ‘manufacture of motor vehicles, trailers and semi-trailers‘ (contribution of 4.8 p.p., growth by 16.3%) ‘manufacture of machinery and equipment‘ (contribution of 4.7 p.p., growth by 33.7%), and ‘manufacture of electrical machinery and apparatus‘ (contribution of 1.9 p.p., growth by 19.1%). New non-domestic orders decreased in ‘manufacture of radio, television and communication equipment and apparatus‘ (contribution -1.6 p.p., drop by 19.8%), ‘manufacture of office machinery and computers‘ (contribution of -0.4 p.p., decrease by 8.0%) and 'manufacture of other transport equipment' (contribution by -0.2 p.p., drop by 9.2%).
The most dynamic industry: Manufacture of machinery and equipment
In Q3 2007, ‘ manufacture of machinery and equipment‘ ranked among industries showing the most dynamic growth which also affected as the third most significant contributor the total results in industry (contribution to the industry in total +1.1 p.p.). The industrial production index y-o-y reached 116.4%, while the two-digit y-o-y growth has been recorded for this industry continuously since Q1 2005.
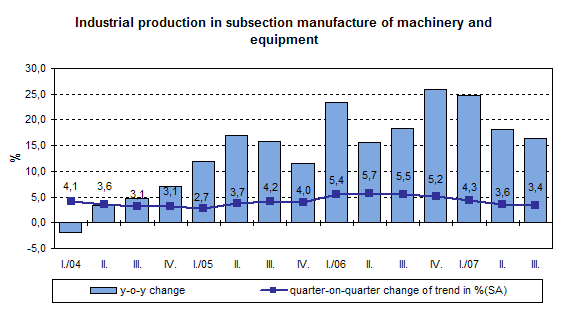
The growth of production responds to the sales growth that was, year-on-year, 16.3% at constant prices and 19.0% at current prices.
Direct export sales in subsection ‘manufacture of machinery and equipment N.E.C.‘ increased compared to Q3 2006 by 21.3% at constant prices and by 23.2% at current prices. Their share in total direct export sales (at current prices) stood at 11.4%.
In Q3 2007, employment in subsection ‘manufacture of machinery and equipment N.E.C.‘ increased, year-on-year, by 7,539 persons, i.e. by 5.5%. Average monthly wage reached, in Q3 2007, CZK 21,105 and was year-on-year, 6.4% up.
In Q3 2007, in subsection ‘manufacture of machinery and equipment N.E.C.‘ new orders increased, y-o-y, by 33.0% (contribution 4.2 p.p.).
In Q3 2007, in subsection ‘manufacture of machinery and equipment N.E.C.‘ the volume of new non-domestic orders increased by 33.7% (contribution 4.7 p.p.).