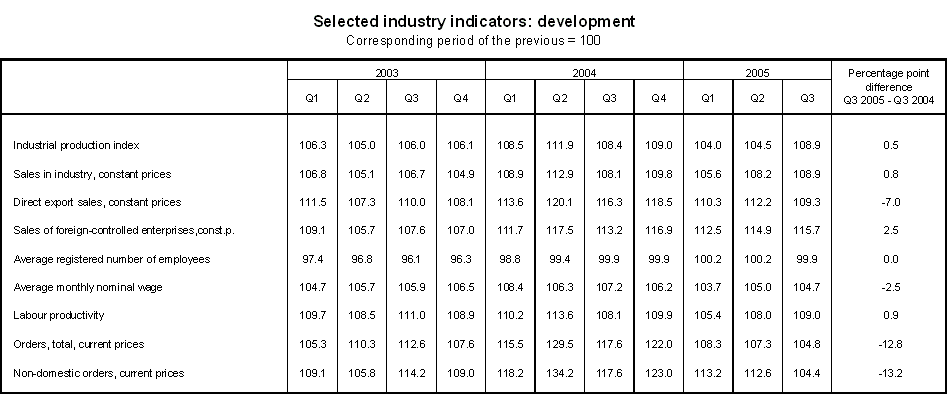
Development of the industry - 3. quarter of 2005
Product Code: e-8019-05
Development of the industry in the 3rd quarter of 2005: analysis
Results for the third quarter of 2005 confirm steady increase in industrial production, especially manufacture of transport equipment and production of selected branches of other industries, which supply to car industry. It applies mainly to manufacture of rubber and plastic products and manufacture of electrical equipment for engines and vehicles. Production increased also in the division of manufacture of machinery and equipment. Industrial production growth is substantially influenced also by foreign-controlled enterprises, which export three quarters of their production. Industrial production grew hand in hand with labour productivity growth and a decrease in unit wage costs.
Production
The year-on-year index of industrial production reached 108.9% in Q3 2005. The highest growth was recorded for:
- manufacture of transport equipment (+23.9%)
- manufacture of rubber and plastic products (+13.5%)
- manufacture of coke, refined petroleum products and nuclear fuel (+20.9%).
Industrial production decreased in:
- manufacture of textiles and textile products (-3.4%)
- mining and quarrying of energy producing materials (-5.3%)
- manufacture of leather and leather products (-4.1%).
In Q3 2005, the industrial production increased in the following main industrial groupings (MIGs): energy (+16.1%), intermediate goods (+11.5%), consumer durables (+5.3%), consumer non-durables (+3.8%), and capital goods (+3.5%).
Sales
In Q3 2005, sales in industry were higher by 8.9% year-on-year (constant prices). They increased most in ‘manufacture of transport equipment’ (+24.7%), ‘manufacture of machinery and equipment’ (+13.1%), ‘manufacture of wood and wood products‘ (+12.9%) and decreased in ‘manufacture of textiles and textile products‘ (-2.0%) and ‘mining and quarrying of energy producing materials’ (-10.4%).
Direct exports
Direct export sales of industrial enterprises increased by 9.3% at constant prices (5.7% at current prices), and their share in total sales of industrial enterprises stood at 48.1% at current prices. Their biggest constant price growth occurred in ‘mining and quarrying except of energy producing materials’ (+41.2), ‘manufacturing n.e.c.’ (+28.8%) and ‘manufacture of wood and wood products‘ (+23.2%), while the biggest decrease was recorded for ‘mining and quarrying of energy producing materials’ (-15.9%), ‘manufacture of leather and leather products‘ (-6.0%), and ‘manufacture of textiles and textile products’ (-0.1%).
Direct export sales index is influenced by changes in organization of trade. Some enterprises do not export their production directly, but via trade organizations. Direct export sales indices are thus undervalued.
Foreign-controlled enterprises
Sales in industry implemented by foreign-controlled enterprises grew by 15.7% at constant prices (12.3% at current prices), and their share in total sales stood at 54.9% at current prices. Direct export sales of these enterprises increased by 5.2% at current prices (9.4% at constant prices) and accounted for 72.0% of total sales.
There were 1 938 foreign-controlled enterprises operating in the industry in the first to third quarter of 2005. They employed over 456 thousand persons with an average wage of CZK 19 817 (11.2% up on the average wage in the total industry).
Employment
In Q3 2005, employment in the industry decreased by 1.1 thousand persons (-0.1%), most in the following industries:
– electricity, gas and water supply (-11.1%)
- manufacture of textiles and textile products (-7.4%)
- mining and quarrying, except of energy producing materials (-7.3%).
It grew most in:
– manufacture of transport equipment (+6.1%)
- manufacture of rubber and plastic products (+5.2%)
- manufacture of wood and wood products (+2.6%).
Wages
Average monthly nominal wage in the industry reached CZK 18 031 in Q3 2005 and was 4.7% up on Q3 2004. The highest level of wages (average monthly nominal wage per employee) was recorded for:
- manufacture of coke and refined petroleum products
- electricity, gas and water supply
- mining and quarrying of energy producing materials.
The lowest level of wages was in:
- manufacture of leather and leather products
- manufacture of textiles and textile products
- manufacturing n.e.c.
Labour productivity
In Q3 2005, labour productivity in the industry went up by 9.0%, growing faster than average monthly nominal wage. Unit wage costs dropped by 3.9%.
New orders (selected industries)
In Q3 2005, new orders worth CZK 344.0 billion were signed and their volume was 4.8% up on Q3 2004.
The growth was ascertained in:
– manufacture of fabricated metal products, except machinery and equipment (+18.6%)
– manufacture of electrical machinery and apparatus n.e.c. (+18.0%)
- manufacture of machinery and equipment (+11.8%)
and decreased in:
– manufacture of wearing apparel; dressing and dyeing of fur (-13.1%)
– manufacture of basic metals (-11.4%)
– manufacture of pulp, paper and paper products (-5.4%).
In the same quarter, new non-domestic orders worth CZK 218.6 billion were signed. Their volume was 4.4% up on Q3 2004.
Increases in the volume of new non-domestic orders were ascertained in:
- manufacture of electrical machinery and apparatus n.e.c. (+23.8%)
- manufacture of radio, television and communication equipment and apparatus (+23.3%)
- manufacture of fabricated metal products, except machinery and equipment (+19.8%)
and decreases in:
– manufacture of medical, precision and optical instruments, watches and clocks (-15.0%)
– manufacture of pulp, paper and paper products (-3.4%).
Development of industry in the EU
Change, % | ||||
June 2005 | July 2005 | August 2005 | ||
| Industrial production index (corresponding period of previous year =100) | Eurozone EU 25 | 0.7 0.7 | 0.6 0.8 | 2.6 1.7 |
| Index of orders (current prices) (corresponding period of previous year =100) | Eurozone EU 25 | 5.5 6.5 | 1.6 2.7 | 7.5 8.9 |
| Industrial production index (SA) (previous month =100) | Eurozone EU 25 | 0.5 0.6 | 0.1 0.1 | 0.8 0.3 |
| Index of orders (SA) (previous month =100) | Eurozone EU 25 | 3.2 2.6 | -1.4 -0.6 | -0.1 0.1 |
Source: News release - 19 October 2005; Industrial production - Eurostat
News release - 22 October 2005; Industrial new orders - Eurostat
http://europa.eu.int/comm/eurostat/

