Development of the economic activity of the population - 1. quarter of 2005
Product Code: e-3133-05
Development of the economic activity of the population in the 1st quarter of 2005
Employment in the primary sector (agriculture, forestry, fishing) decreased to 188.0 thousand persons and accounted for only 4.0% of the total number of first (main) job holders. The number of persons employed in the secondary sector increased by 27.9 thousand year-on-year to 1 850.1 thousand (39.3% of total employment). This growth is mainly attributed to an increase of +25.7 thousand in employment in construction. The number of employed persons increased most in building and civil engineering (+14.9 thousand), building installations (+8.3 thousand) and site preparation (+3.7 thousand). It dropped in mining and quarrying (-6.7 thousand in total), which was brought about by a decrease of 4.1 thousand in the number of persons employed in mining and agglomeration of hard coal in particular.
Employment in the sector of services increased by 6.4 thousand to 2 663.5 thousand (56.6% of total employment) and developed in individual industries developed in an opposing way:
– it grew most in education (+13.3 thousand; most in primary education, +9.2 thousand), health and social work (+11.3 thousand; most in human health activities, +12.4 thousand) and hotels and restaurants (+10.0 thousand; most in restaurants, +5.9 thousand, and canteens and catering, +4.5 thousand);
– it decreased most year-on-year in real estate; renting and business activities (-16.1 thousand; mainly in miscellaneous business activities n.e.c., -11.4 thousand), wholesale and retail trade; repair of motor vehicles, motorcycles and personal and household goods (-9.5 thousand; most significantly in retail sale in non-specialized stores, -10.9 thousand) and also considerably in transport, storage and communications (-7.8 thousand; mainly in activities of travel agencies and tour operators; tourist assistance activities n.e.c., -3.3 thousand).
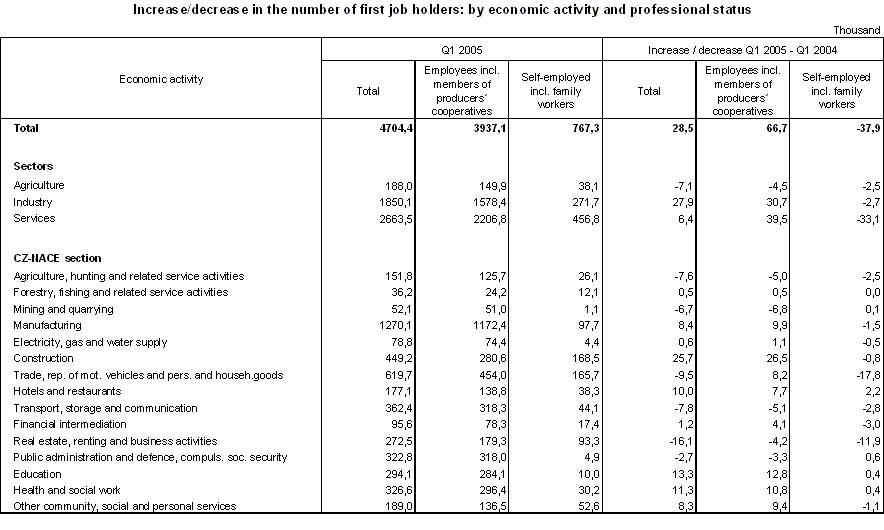
A number of industries (economic activities) saw the self-employed without employees also dropping in number (- 33.6 thousand in total on Q1 2004), which had a key influence on the reduction of the whole business sphere. In addition to the above-mentioned NACE groups, the largest decreases in the number of these own-account workers also occurred in insurance and pension funding, except compulsory social security, in maintenance and repair of motor vehicles and in retail sale in non-specialized stores.
Data produced by Eurostat suggest that despite the drop in the number of the self-employed, their proportion in the CR’s total employment remains above the average of that of the other EU member states and Norway . The significance of the business sphere can be demonstrated by proportions of numbers of the self-employed with and without employees (excluding family workers) in total employment levels in respective sectors or industries of the EU member states. The table below shows these figures for economic activities as classified in CZ-NACE—which is fully compatible with the international NACE—and for the whole EU and its selected member states. The figures are related to the latest available results for Q2 2004.
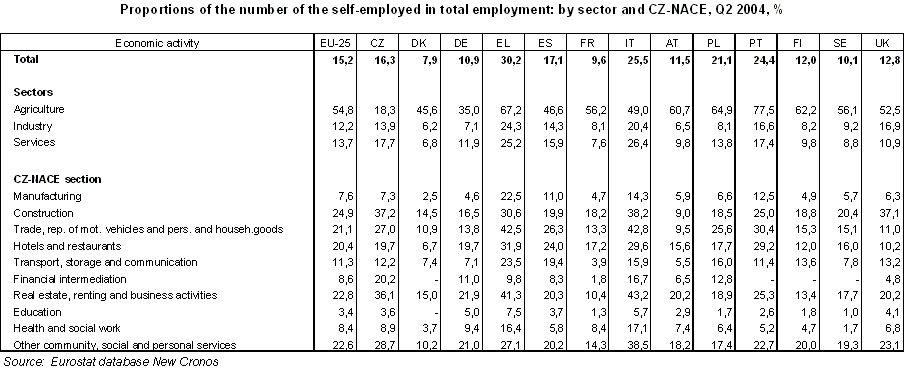
– along with Slovakia: the smallest proportion of the self-employed in the number of persons employed in agriculture and forestry (18.3% in the CR as against 54.8% in the EU-25)
– along with Italy and the UK: the largest proportion of the self-employed in the number of persons employed in construction (37.2% in the CR as against 24.9% in the EU-25)
– a high proportion of the self-employed in wholesale and retail trade; repair of motor vehicles, motorcycles and personal and household goods (27.0% in the CR as against 21.1% in the EU-25); relatively higher proportions in this industry existed only in five countries of the Mediterranean region (Greece. Italy, Portugal, Cyprus, and Malta)
– the largest proportion of the self-employed in financial intermediation—almost 2.5 times as much as the proportion of the total for the EU member states (20.2% in the CR as against 8.6% in the EU-25)
– after Greece and Italy: the largest proportion of persons self-employed in real estate; renting and business activities (36.1% in the CR as against 22.8% in the EU-25) and, similarly, the third largest proportion of persons self-employed in other community, social and personal service activities (28.7% in the CR as against 22.6% in the EU-25).
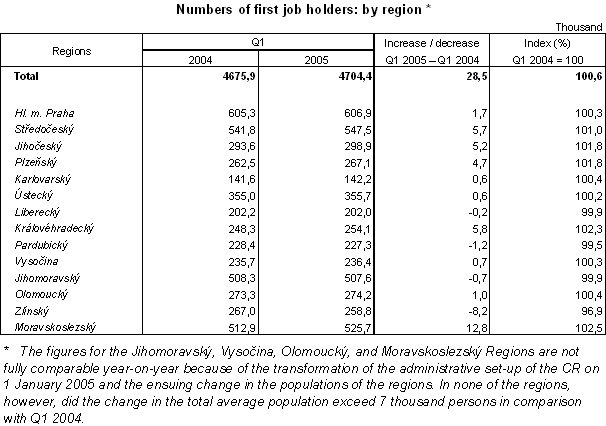
Employment of persons living in regions decreased year-on-year in four administrative regions of the country, in absolute terms most in the Zlínský and Pardubický Regions. On the other hand, the number of employed persons grew most in the Moravskoslezský Region, which suffers from high unemployment heavily, the Královéhradecký Region and the Středočeský Region.
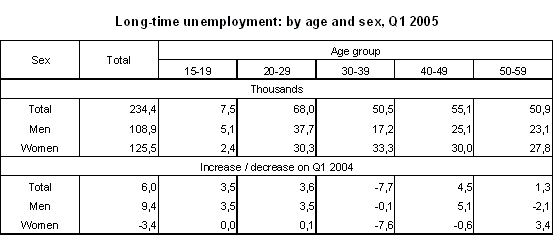
The continued growth of the number of persons in long-lasting unemployment (1 year or more) is characteristic of the development of unemployment. This number increased by 6.0 thousand and the increases recorded for the groups of young men aged 15-29 (+7.0 thousand), men aged 40-49 (+5.1 thousand) and women aged 50-59 (+3.4 thousand) are especially worrying.
The number of the unemployed with basic education grew by 0.1% year-on-year to reach 104.1 thousand. Positive development was observed in other groups of respondents, with higher qualification levels. The number of the unemployed with secondary education without GCSE (with secondary vocational education in particular) dropped by 5.2% to 215.2 thousand. The number of the unemployed with secondary education with GCSE dropped by 1.4% to 96.1 thousand and that of unemployed university graduates by 8.4% to 14.0 thousand.
Year-on-year, the unemployment dropped most in the Středočeský , Moravskoslezský and Hl. m. Praha Regions. The situation got worse, though, in the Zlínský and Karlovarský Regions in particular.
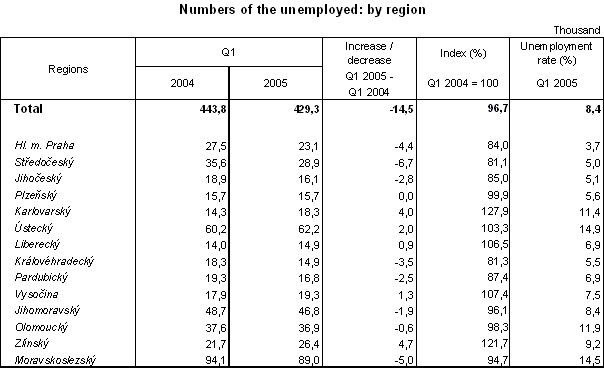
The growth of total employment and the decrease in the number of unemployed persons brought about a rather high decrease in the general unemployment rate . Compared to Q1 2004, the general unemployment rate decreased by 0.3 percentage points to 8.4%. The rate dropped in the female population only (by 0.7 percentage points to 9.6%) and remained unchanged in the male population.
The number of economically inactive persons aged 15+ (according to the LFSS methodology they are persons who had no job and were not seeking any job during last four weeks or failed to meet all conditions for being classified among the unemployed) increased by 16.5 thousand in a year and reached 3 558.5 thousand in Q1 2005. This category is primarily affected by numbers of retired persons and persons preparing for their future occupations. The number of basic school pupils decreased by 12.1 thousand and the number of apprentices by 1.5 thousand. The number of secondary school pupils increased by 7.1 thousand to 386.8 thousand. The number of university students or higher professional school students grew rapidly, by 20.5 thousand, to 247.6 thousand. The number of economically inactive, normally retired persons not seeking any job actively rose by 14.5 thousand to 1 821.8 thousand and the number of persons in early retirement dropped by 2.1 thousand to 72.5 thousand. The number of disability pensioners increased by 7.9 thousand to 311.0 thousand. However, these figures cannot accurately correspond to the statistics on pupils and students compiled by the Ministry of Education, Youth and Sports of the CR or to the numbers of pensioners on records of the Ministry of Labour and Social Affairs of the CR, because the pupils, students or pensioners who qualified for being classified among persons in employment or unemployment in the reference week are not reported as economically active.
