Development of external trade price indices - 4. quarter of 2006 and year 2006
Product Code: e-7232-06
Development of external trade price indices in the fourth quarter of 2006 and in the year 2006
Development of external trade price indices in the Q4 2006
Month-on-month comparison:
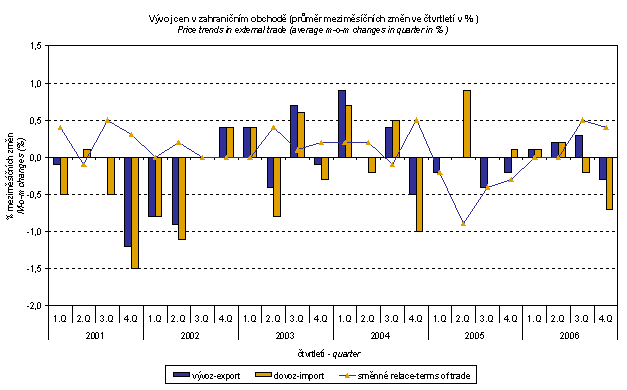
Import prices decreased in average in the Q4 2006 by -0.7% month-on-month (in the Q3 by -0.2%). Export prices decreased in average in the Q4 2006 by -0.3% month-on-month (while in the Q3 they increased by 0.3%).
During the Q4, there were the biggest m-o-m decreases of prices in ‘mineral fuels, lubricants and related materials‘ (mainly petroleum, petroleum products and natural gas). This development was fully in accord with the development of prices on world markets: correlation of m-o-m indices of Brent petroleum prices on world markets and of petroleum and petroleum products subsection reached in the year 2006 the value of 0.83 for import and 0.77 for export. Thus, it was a strong correlation even in the situation, in which the relation of petroleum and petroleum products prices (important share of this subsection especially in export) is rather loose and especially in the situation, in which Brent petroleum prices on world markets are surveyed in USD, while external trade price indices are calculated from prices in CZK.
Relation of external trade price indices to exchange rates of main foreign currencies is very important, often even decisive in m-o-m expression, which is shown also in the graphs below.
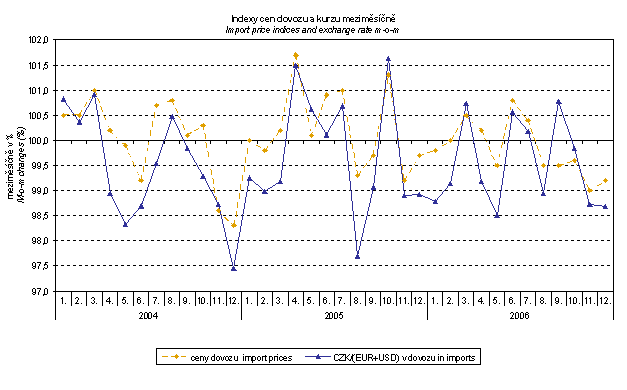
The month-on-month exchange rate index includes two most important currencies from the point of view of Czech external trade, i.e. EUR and USD; m-o-m indices of CZK exchange rates to those currencies were weighted by the weight, which pertains to those currencies in the import price index. Correlation of this total m-o-m import exchange rate index and the m-o-m import price index in 2006 was 0.62; correlation of m-o-m exchange rate index of USD only (which has much bigger weight in the currency basket of import than of export) to CZK and the m-o-m import price index in the same period was even 0.92.
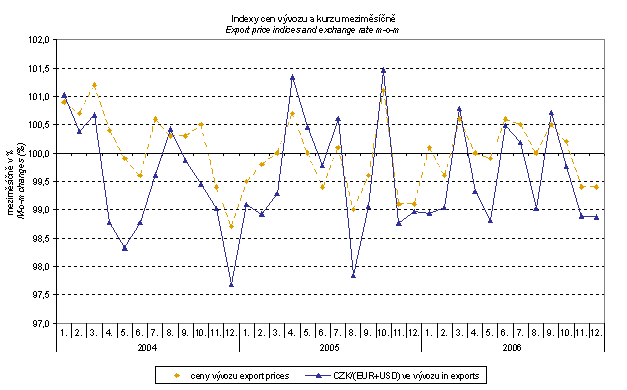
Similarly, when comparing with m-o-m export price indices, m-o-m EUR and USD exchange rate indices were weighted by the weight, which pertains to those currencies in the export price index. Correlation of this total m-o-m export exchange rate index and the m-o-m export price index in 2006 was 0.87.
Thus, it becomes clear that both in the case of import and export, external trade prices in the m-o-m expression have a strong relation to exchange rate influences. It is a rather logical conclusion, because contracts with foreign entities are usually made for a longer period and thus “not much happens” month-on-month in external trade prices after elimination of exchange rate influences under normal conditions.
“Normal conditions”, however, are important for the close dependence. Bigger differences between price and exchange rate indices were observed mainly in the months, in which more marked price changes were reported at mineral fuels and metals.
In Q4 2006, the terms of trade value was 100.4% (in Q3 2006 it was 100.5%). The highest terms of trade value was in ‘mineral fuels, lubricants and related materials‘ 101.8%. In the most important section in terms of weights ‘machinery and transport equipment’ the terms of trade reached 100.1%, i.e. by 0.1 p.p. less than in the Q3 2006. The negative terms of trade value was only in ‘chemicals and related products‘ 99.8%.
Year-on-year evaluation:
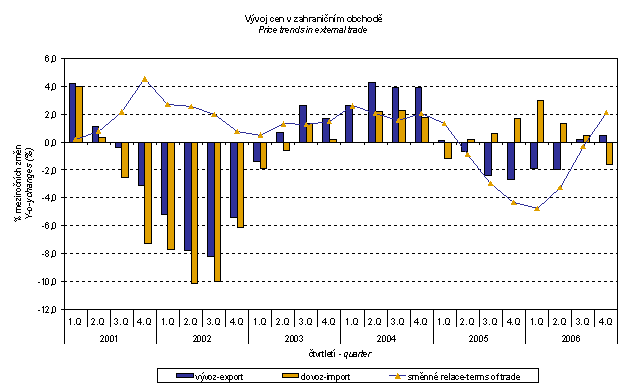
Development of external trade prices in individual months of the Q4 2006 was different in movement of import prices in comparison to export prices and the “price scissors” were thus markedly opening. While import prices gradually decreased by 1.3% (October to October), by 1.5% (November to November), and by 2.0% (December to December), export prices gradually grew from 0.2% to 0.5% up to 0.8%. The main reasons for this development were gradual strengthening of CZK mainly to USD and also a price decrease of petroleum prices on world markets.
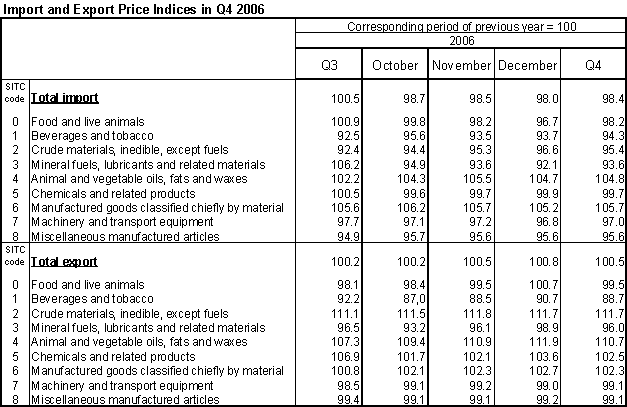
Import prices decreased in the Q4 2006 by 1.6% in average (while in the Q3 they increased by 0.5%). The biggest fall was observed (in relation to the development on world markets) among prices of ‘mineral fuels, lubricants and related materials‘ (mainly coal, natural gas and petroleum). Also prices of almost all surveyed sections decreased, prices of ‘machinery and transport equipment’ by -3.0% (especially telecommunication and sound recording and reproducing apparatus). From important sections as for weights, only prices of 'manufactured goods classified chiefly by material' increased by 5.7% (mainly non-ferrous metals).
Export prices increased in the Q4 by 0.5% in average. Prices grew despite strengthening of CZK to EUR and USD. The most marked growth was among ‘crude materials, inedible, except fuels‘ by 11.7% (mainly metalliferous ores and metal scrap). The same as for import, also export prices of 'manufactured goods classified chiefly by material' increased by 2.3% (again mainly non-ferrous metals). The same as for import also export prices decreased among ‘mineral fuels, lubricants and related materials‘ by -4.0% (mainly natural gas and petroleum products) and ‘machinery and transport equipment’ by –0.9% (especially road vehicles).
Terms of trade reached the positive value of 102.1% y-o-y in the Q4 2006 (i.e. by 2.4 p.p. more than in the Q3 2006); terms of trade were growing quarterly during the entire year 2006 (see the graph below). The highest value was in ‘crude materials, inedible, except fuels‘ 117.1%, ‘machinery and transport equipment’ 102.2% (in the Q3 100.8%). From important sections as for weight, a negative value of terms of trade was only at 'manufactured goods classified chiefly by material' 96.8%.
Development of external trade price indices in the year 2006
Import prices increased in 2006 in average by 0.8% year-on-year (in 2005 by 0.3%). The biggest increase was observed among prices of ‘mineral fuels, lubricants and related materials’ by 12.8% (especially natural gas, petroleum and petroleum products). As for others, growing were only prices of 'manufactured goods classified chiefly by material' by 3.6% (non-ferrous metals in particular). Prices of ‘machinery and transport equipment’ decreased by 2.0% (mainly telecommunications and sound-recording and reproducing apparatus and equipment). From important sections as for weight, the biggest price decrease was among ‘miscellaneous manufactured articles‘ by –5.6% (mainly articles of apparel and clothing accessories).
Export prices, on the contrary, decreased in 2006 in average by -0.8% year-on-year (in 2005 by -1.4%). The most marked y-o-y price increase was among ‘crude materials, inedible, except fuels‘ by 8.5% (mainly metalliferous ores and metal scrap). From important sections as for weight, increasing were only prices of ‘chemicals and related products‘ by 2.1%. Prices of other observed sections decreased, the biggest drop was among 'manufactured goods classified chiefly by material' by -1.7% (leather products in particular). Prices of machinery and transport equipment decreased by -1.5% (mainly road vehicles).
What was the reason for the different price development of import and export prices? As it was shown already above, external trade prices are influenced by many influences; among others it is CZK exchange rate to foreign currencies. This influence is very important and often even decisive, especially in the month-on-month expression; however, it markedly influences also the level of y-o-y external trade price indices.
The CZSO makes experimental calculations of external trade price indices adjusted for exchange rate influences. The method used does not allow due to many practical reasons to make a 100% exchange rate adjustment (i.e. not all observed deals made in foreign currencies are for the needs of calculation of external trade price indices also reported as such – this share, however, makes only about 25%). Nevertheless, it was verified that even together with an increasing share of reporting in foreign currencies the currency basket remains basically constant. Thus, it can be stated that at the full exchange rate adjustment the differences between the published price indices and price indices that were adjusted would be even bigger.
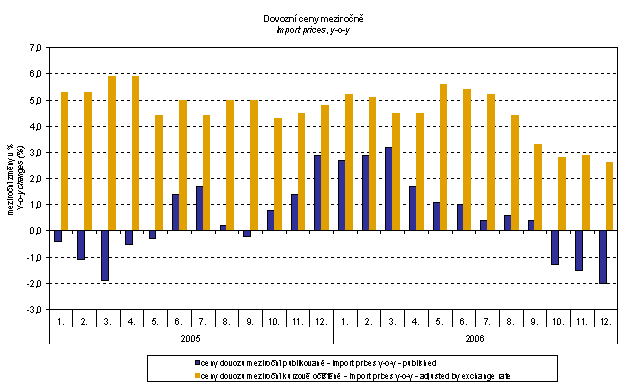
It is clear from the graph that the exchange rate influence was important for the amount of import price indices. In all months of the year 2006, it decreased their amount (CZK in total was appreciating to foreign currencies). After elimination of the exchange rate influence, import prices would have been growing in all months of 2006.
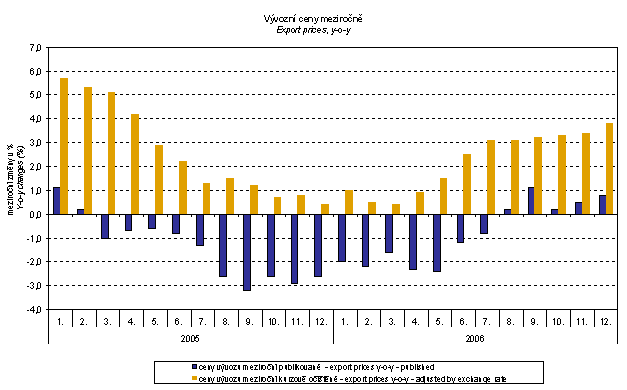
It is clear from the graph that the exchange rate influence was important also for export price indices. In all months of the year 2006, it decreased their amount. After elimination of the exchange rate influence, export prices (the same as import prices) would have been growing in all months of 2006.
Year-on-year terms of trade reached in total in the year 2006 the negative value of 98.4%, i.e. by 0.1 percentage point more than in 2005.
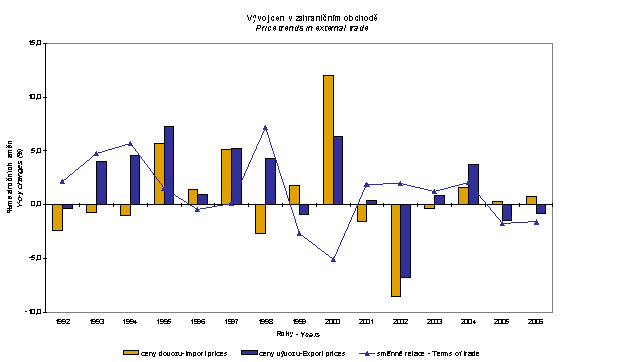
The highest value of terms of trade was mainly in ‘crude materials, inedible, except fuels‘ 115.2% and in ‘miscellaneous manufactured articles‘ 104.8%. Terms of trade of ‘machinery and transport equipment’ reached the value of 100.5%, i.e. by 0.5 p.p. more than in 2005. The lowest terms of trade value was in ‘mineral fuels, lubricants and related materials’ 88.5%.
What influenced development of the year-on-year terms of trade in the year 2006 and how terms of trade of individual sections developed during the year?
It was shown already above that external trade price indices are markedly influenced by the development of CZK exchange rate to foreign currencies, especially to EUR and USD.
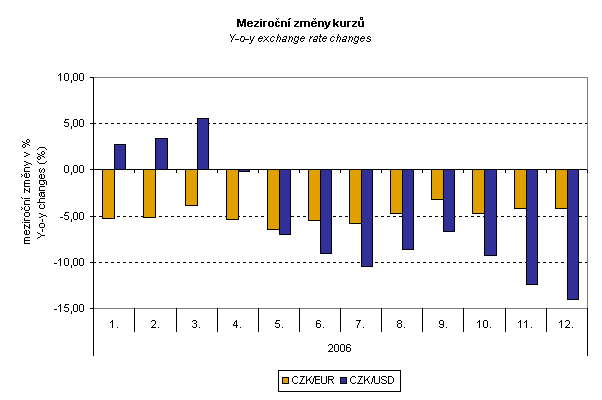
However, since the share of prices contracted in EUR is higher for export than for import, the exchange rate development of CZK to EUR and USD influences also the development of terms of trade.
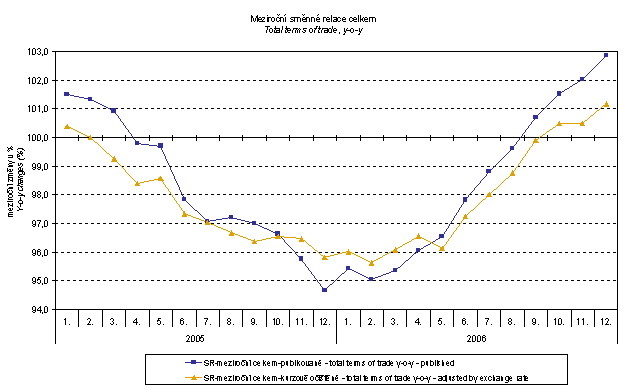
It is clear from the graph that while in the first 4 months of the year 2006 the exchange rate was decreasing year-on-year terms of trade, during the last 8 months of the year it was in the opposite way. The reason is that in the currency basket the USD share is higher for import than for export. In the first 4 months of 2006, CZK was mostly depreciating to USD (unlike EUR). Therefore, the exchange rate development was decreasing import prices more than export prices and thus decreased terms of trade in total. In the following 8 months it was vice-versa. It is also clear from the graph that even without the exchange rate influence the terms of trade would be gradually growing since May 2006, but the influence was further strengthening the growth.
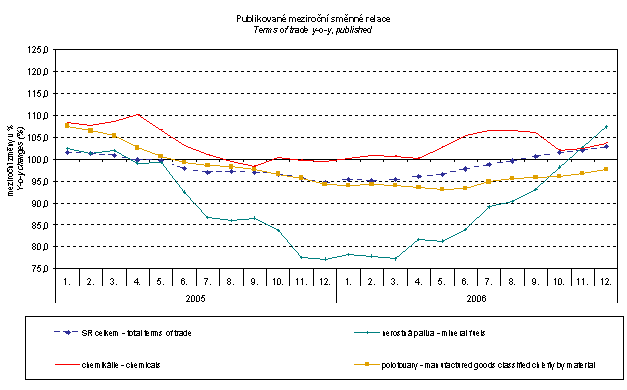
What are other causes of gradual growth of year-on-year terms of trade during the year 2006? The graph above shows sections with the most marked development of terms of trade in 2006. They are 'manufactured goods classified chiefly by material' (metals and manufactures of metals in particular) and, most of all, 'mineral fuels, lubricants and related materials' and also chemicals related to them (especially organic chemicals). That means sections with the most marked price turbulences during the year 2006. How would terms of trade value develop after we exclude 'mineral fuels, lubricants and related materials'?
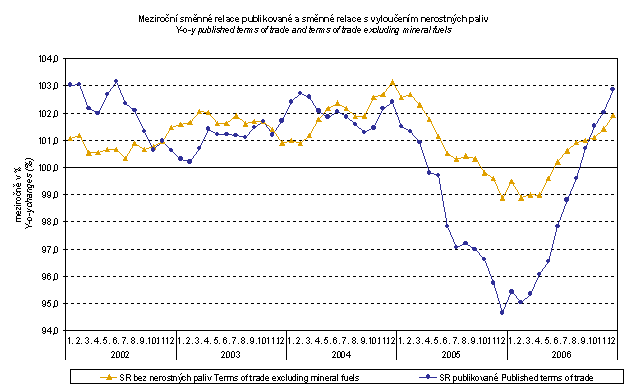
The graph above shows that 'mineral fuels, lubricants and related materials' were decreasing the total value of terms of trade during the first 9 months of 2006 and in the last 3 months of 2006 it was vice-versa. Of course, it is related to price development on world markets, especially to crude petroleum. Import prices, which have higher share of raw materials in comparison to export prices, do react in a more sensitive way on price turbulences and therefore at growth of prices of raw materials the terms of trade are usually decreasing and, vice-versa, when raw materials prices are decreasing the terms of trade are growing.
Elaborated by: Jiří Choun, Prices Statistics Department
Director: Jiří Mrázek, phone (+420) 27405 2533
