Development of external trade price indices - 3. quarter of 2005
Product Code: e-7232-05
14 November 2005
Development of external trade price indices in the third quarter of 2005
Month-on-month evaluation:
Import prices did not change in the average in the third quarter of 2005 month-on-month (in the second quarter the average m-o-m growth was 0.9%). Export prices were decreasing in the average for the third quarter by 0.4% month-on-month (in the second quarter they did not change in average, m-o-m). Both import and export prices had similar development in the third quarter: they were increasing in July and decreasing in August and September. In the third quarter in total as for both import and export, prices were decreasing basically in all significant sections measured except for 'mineral fuels, lubricants and related materials.'
Prices of 'mineral fuels, lubricants and related materials' increased in import by 3.1% and in export by 0.8%. In 'mineral fuels, lubricants and related materials' also the biggest fall of percentage points was reported both for import and export: by 3.1 and 2.1, respectively. This development was also in accord with development of prices on world markets: the correlation of month-on-month indices of Brent petroleum prices on world markets and the subgroup of petroleum, petroleum products and related materials reached in January to September 2005 the value of 0.55 for import and 0.38 for export. In the situation, in which the relation of prices of petroleum, petroleum products and related materials (important share in this subgroup especially in export) is rather loose and namely in the situation, in which Brent petroleum prices on world markets are measured in USD, while external trade price indices are calculated from prices in CZK, the correlation was rather strong.
At the same time, the relationship of external trade price indices to exchange rates of main foreign currencies is very important, often even decisive in a month-on-month expression, as described in the graphs below.

Two most important currencies from the point of view of external trade of the CR, i.e. EUR and USD, were included in the month-on-month exchange rate index; m-o-m indices of CZK exchange rates to those currencies were weighted by the weight, which pertains to those foreign currencies in the import price index. The correlation of this total m-o-m import exchange rate index and the m-o-m import price index in January to September 2005 was 0.89.
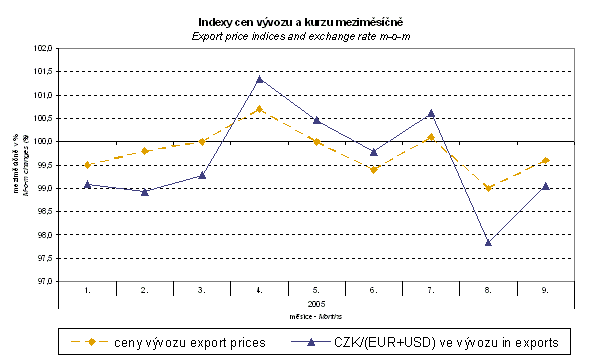
Similarly, when compared to m-o-m export price indices, the m-o-m indices of exchange rates of EUR and USD were weighted by the weight, which pertains to those currencies in the export price index. The correlation of the total m-o-m export exchange rate index and the m-o-m export price index in January to September 2005 was 0.86.
Thus, it can be seen that both for import and export external trade prices in a month-on-month expression have a strong relationship to exchange rate influences. It is a rather logical conclusion, because contracts with foreign entities are usually concluded for a long-term. Exceptions were especially prices of fuels in a close relationship to stormy price development of mainly petroleum and natural gas on world markets.
Year-on-year evaluation:
Import prices increased year-on-year by 0.6% in the third quarter (growth by 0.4 percentage points), while export prices decreased by 2.4% (drop by 1.7 percentage points). Resulting from this development was rather marked decrease in y-o-y terms of trade. In individual months of the third quarter, however, prices were gradually decreasing y-o-y for both import and export. The development was caused by CZK appreciation to main foreign currencies as well as by the development of world prices, especially of petroleum and natural gas. The y-o-y growth of Brent petroleum prices was decreasing from 53.5% in July 2005 gradually down to 49.5% in September and as for natural gas it was from 50.0% to 49.2%.
Especially, the influence of the development of CZK exchange rate to main foreign currencies on external trade price indices is very important. Unlike in the month-on-month comparison, the correlation between these quantities is not so strong in the case of year-on-year comparison (in the y-o-y comparison the price development as such is much more marked); however, exchange rate influences have a marked influence on the amount of external trade price indices.
Therefore, the CZSO makes experimental exchange rate adjustments of these indices for its analytical purposes. Direct exchange rate adjustment of individual price representatives both in m-o-m and y-o-y comparisons enables gradual aggregation of indices adjusted like that for individual price representatives via groups up to adjusted total index of import and export, namely in the breakdown by SITC (down to the two-digit code) as well as the customs tariff (down to the four-digit code) and CZ-CPA (down to the CZ-CPA three-digit code). The method used does not allow 100% exchange rate adjustment due to many practical reasons (i.e. not all measured trades in foreign currencies are also reported as such for the needs of calculation of external trade price indices – this share, however, makes only about 25% and the method thus seems to be applicable for analytical purposes).
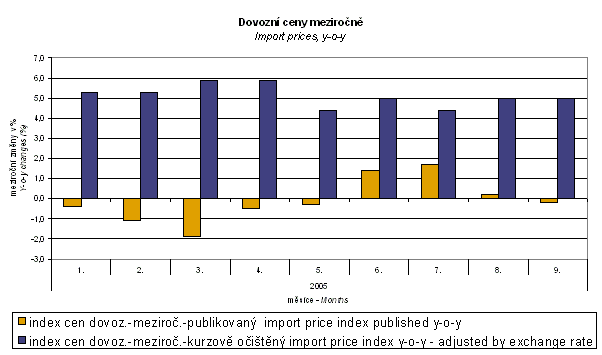
It is clear from the graph that the exchange rate influence is important for the year-on-year index of import prices. In 6 cases out of 9, the y-o-y change in % for the published index had even different sign than it would have as for the seasonally adjusted index.
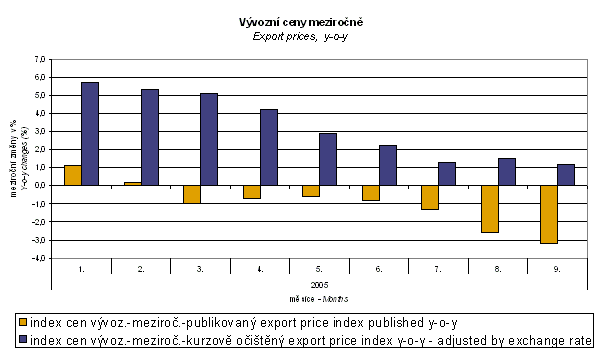
Of similar importance was the exchange rate influence also as for the year-on-year index of export prices. There, even in 7 cases out of 9 the y-o-y change in % for the published index had a different sign than it would have in the seasonally adjusted index. At the same time, it is clear from a comparison of both graphs that to a certain extent “suspicious” development in some months, in which the published y-o-y changes of import prices had other sign than export prices, can be fully explained by the exchange rate. Without that influence, prices of both import and export would increase y-o-y during the entire period measured.
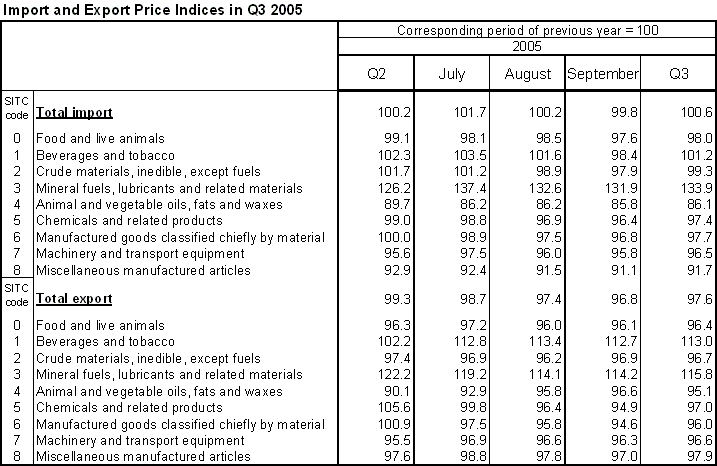
Growth of import prices was decreasing y-o-y during individual months of the third quarter from +1.7% via +0.2% down to a decrease by -0.2%. The total growth of import prices by 0.6% in the third quarter was influenced the most by an increase in prices of 'mineral fuels, lubricants and related materials' by 33.9% (especially natural gas and petroleum, petroleum products and related materials). Otherwise prices of all significant sections measured decreased and except for 'machinery and transport equipment' they deepened their price fall when compared to the second quarter. Prices of that section decreased by 3.5% (in the second quarter by 4.4%). The biggest drop was recorded in 'miscellaneous manufactured articles' - by 8.3%.
Also export prices were gradually decreasing during the third quarter. They were falling by 1.3%, 2.6% and 3.2% in the individual months. Similarly as for import prices, also in export prices of all significant sections measured were decreasing except for 'mineral fuels, lubricants and related materials'. Prices of that section grew in the third quarter by 15.8% y-o-y (mainly petroleum products). Prices of 'machinery and transport equipment' fell by 3.4% (power-generating machinery and equipment in particular).
Year-on-year, terms of trade reached a negative value of 97.0% in the third quarter of 2005 and in comparison to the second quarter they thus deepened their fall by 2.1 percentage points. The trend of decreasing terms of trade level from the beginning of 2005 thus continued.
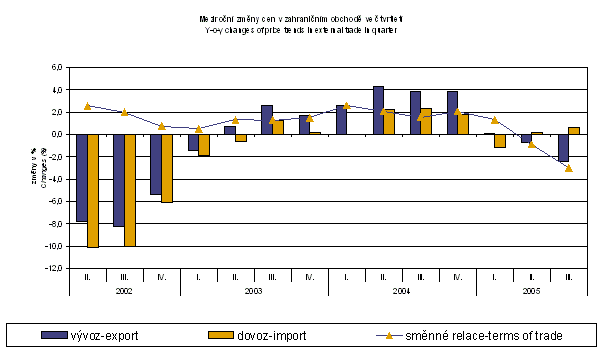
The lowest terms of trade value in the third quarter of 2005 as for significant sections was in 'mineral fuels, lubricants and related materials' - 86.5%, while the highest was for 'miscellaneous manufactured articles' - 106.8%. The terms of trade value for 'machinery and transport equipment' was 100.1% and in comparison with the second quarter it increased by 0.2%.
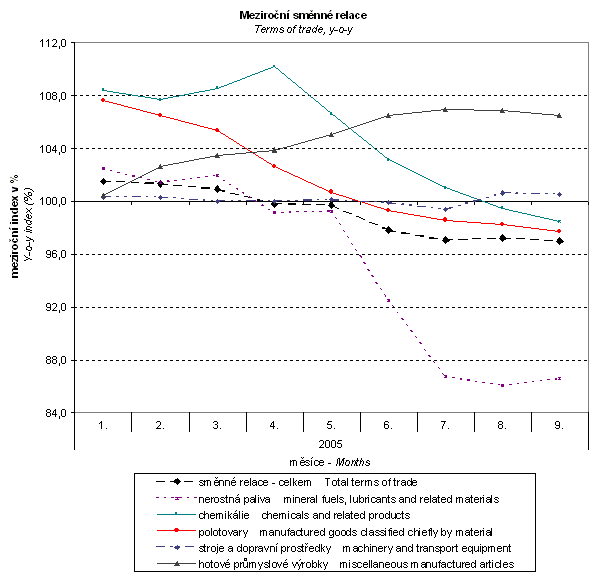
It is clear from the above graph that the decrease in terms of trade value has a long-term character. Only significant sections are mentioned in the graph or those with a dynamic development of the terms of trade value in 2005 (the weight of the selected sections exceeds 90%).
The terms of trade value decreased the most markedly in 'mineral fuels, lubricants and related materials' during the year 2005. It was due to a sharp increase in prices of petroleum and petroleum products (a decisive part of 'mineral fuels, lubricants and related materials' in import) on world markets and a slower increase of coal prices (the main part of 'mineral fuels, lubricants and related materials' in export). Closely related to the decrease of the value in the section of 'mineral fuels, lubricants and related materials' was also a decrease of the terms of trade value in the section of 'chemicals and related products'. On the contrary, price decrease of iron had a major influence on the terms of trade value decrease in the section of 'manufactured goods classified chiefly by material.' The most important section in terms of weight - 'machinery and transport equipment' – did not have a big influence on the terms of trade value development in 2005. Thus, the only important section, which had a positive influence on the y-o-y terms of trade development in the period measured, was the section of 'miscellaneous manufactured articles.'
Elaborated by: Jiří Choun, Prices Statistics Department
Director: Jiří Mrázek, phone number (+420) 27405 2533
