Development of external trade price indices - 2. quarter of 2006
Product Code: e-7232-06
Development of external trade price indices in the second quarter of 2006
Month-on-month evaluation:
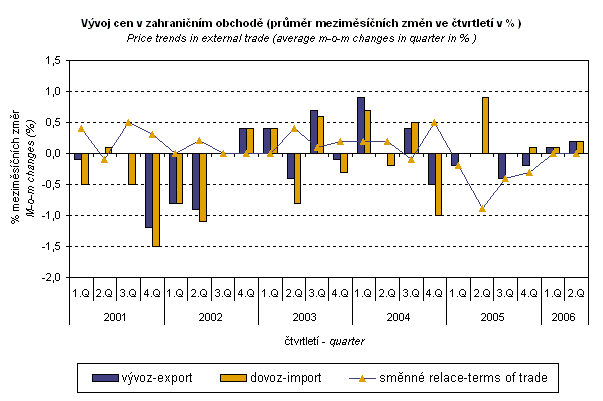
In Q2 2006, both import and export prices in total increased in average by 0.2% month-on-month. The same as in Q1, in harmony with the development of prices on world markets, especially import prices of mineral fuels and metals were increasing more rapidly. As for export prices, a marked increase was in chemicals, especially organic.
In Q2, the fastest growth occurred in import prices of ‘mineral fuels, lubricants and related materials’ by 0.9% (mainly petroleum, petroleum products and related materials) and prices of ‘manufactured goods classified chiefly by material’ – also by 0.9% (non-ferrous metals in particular); prices of chemicals and related products increased by 0.3% (mainly organic). Decreasing were prices of ‘crude materials, inedible, except fuels‘ (-0.7%), ‘miscellaneous manufactures articles’ (-0.6%, mainly articles of apparel and clothing accessories), and ‘machinery and transport equipment’ by 0.3% (especially road vehicles, and office machines and automatic data-processing machines). Prices of food dropped by 0.3%.
In export prices, as for more significant sections, the most increasing were prices of ‘chemicals and related products’ (+0.7%, especially organic chemicals and plastics), and ’crude materials, inedible, except fuels‘ (+0.4%, mainly metalliferous ores and metal scrap), ’mineral fuels, lubricants and related materials’ (also +0.4%, mainly petroleum products), and ‘manufactured goods classified chiefly by material’ (+0.3%, non-ferrous metals in particular). Prices of ‘machinery and transport equipment’ increased in average by 0.1% (mainly metalworking machinery). As for significant sections in terms of weights, decreasing were only prices of ‘miscellaneous manufactures articles’ (-0.2%); prices of food did not change in average.
External trade prices were significantly influenced again mainly by CZK exchange rate to main foreign currencies.
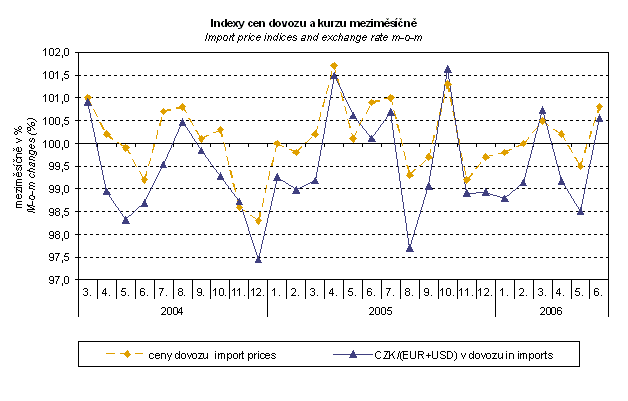
The month-on-month exchange rate index includes two most important currencies from the point of view of Czech external trade, i.e. EUR and USD; m-o-m indices of CZK exchange rates to those currencies were weighted by the weight, which pertains to those currencies in the import price index.
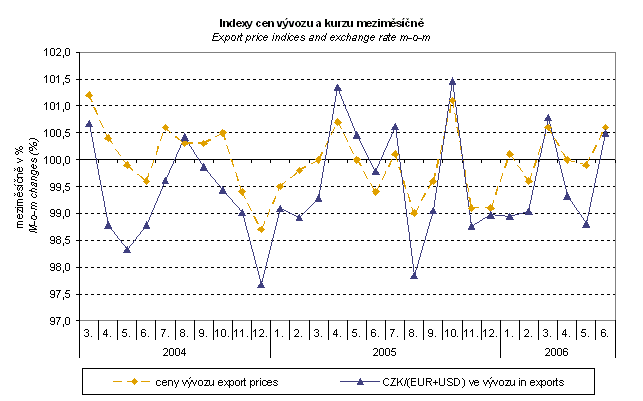
Export prices, similarly as import prices, when comparing m-o-m EUR and USD exchange rate indices were weighted by the weights, which pertain to those currencies in the export price index. It is clear from the above-mentioned graphs that there is a rather strong correlation between month-on-month external trade price indices and CZK exchange rates to main foreign currencies.
In Q2 2006, the terms of trade value was 100.0%, the same as in the Q1 2006. The highest terms of trade value was in ‘crude materials, inedible, except fuels’ (101.1%, by 0.6 p.p. less than in Q1), while the lowest in ‘manufactured goods classified chiefly by material’ (99.4%). In the most important section in terms of weights ‘machinery and transport equipment’ the terms of trade reached 100.4%, i.e. by 0.3 p.p. more than in the Q1 2006.
Year-on-year evaluation:
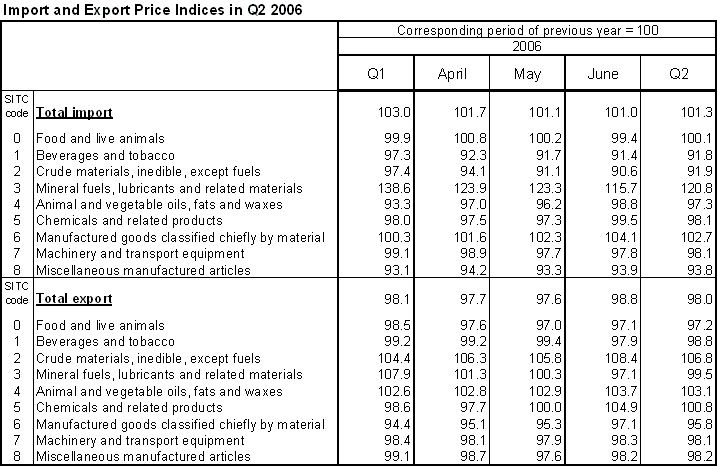
In Q2, import prices in total increased in average by 1.3% year-on-year, while export prices decreased by 2.0%. Similarly as in the month-on-month development, import prices were influenced by increasing prices of ‘mineral fuels, lubricants and related materials’ and metals on world markets; the decrease of export prices reflected lower prices of ‘machinery and transport equipment’, ‘manufactured goods classified chiefly by material’, and ‘food and live animals‘.
As for import prices, which were increasing already from the Q2 2005, the most marked growth was in prices of ‘mineral fuels, lubricants and related materials’ (+20.8%, mainly petroleum, petroleum products and related materials, and gas). Besides that section, increasing were only prices of ‘manufactured goods classified chiefly by material’ (+2.7%, especially non-ferrous metals) and ‘food and live animals‘ (+0.1%). Prices of other sections decreased, most of all in ‘crude materials, inedible, except fuels’ (-8.1%, metalliferous ores prices fell significantly), and in ‘miscellaneous manufactures articles’ (-6.2%, articles of apparel in particular). Prices of ‘machinery and transport equipment’ dropped by 1.9% (especially power-generating machinery and equipment) the same as prices of ‘chemicals and related products‘ (mainly plastics and essential oils).
Export prices recorded in the Q2 2006 a decrease of prices in almost all of the observed sections; the total index was influenced most by a cut in prices of ‘manufactured goods classified chiefly by material’ by 4.2% (mainly leather and iron and steel); however, there was a marked price growth of non-ferrous metals and prices of ‘machinery and transport equipment’ by 1.9% (mainly road vehicles). As for other sections, decreasing were prices of ‘food and live animals‘ (-2.8%), and ‘miscellaneous manufactured articles‘ (-1.8%). Index of ‘mineral fuels, lubricants and related materials’ dropped by 0.5% due to low export prices of coal (although prices of petroleum products, gas and electricity were growing markedly). As for significant sections in terms of weights, prices were growing in ‘crude materials, inedible, except fuels’ (+6.8%, especially metalliferous ores and metal scrap) and ‘chemicals and related products‘ (+0.8%, the most in inorganic chemicals and fertilizers).
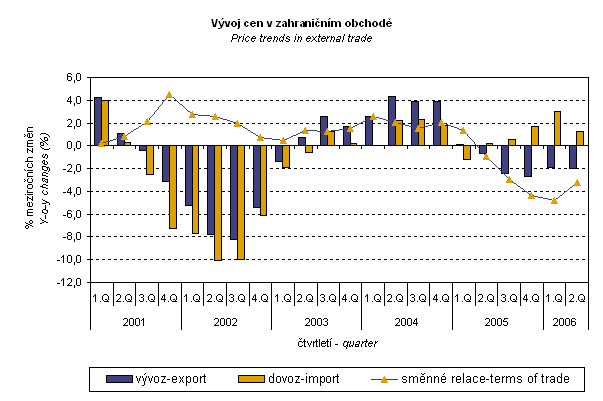
Terms of trade reached the negative value of 96.7% year-on-year in the Q2 2006, which is by 1.5 percentage point more than in the Q1 2006. As for significant sections in terms of weights, the terms of trade value was highest in ‘crude materials, inedible, except fuels’ (116.2%), ‘miscellaneous manufactured articles’ (104.7%), and ‘chemicals and related products‘. On the contrary, the lowest values of terms of trade were in ‘mineral fuels, lubricants and related materials’ (82.4%), and ‘manufactured goods classified chiefly by material‘ (93.3%). In ‘machinery and transport equipment’ the value was 100.0%, i.e. by 0.7 percentage point higher than in the Q1 2006.
Elaborated by: Prices Statistics Department
Director: Jiří Mrázek, phone number (+420) 27405 2533
