Development of consumer price indices - 4. quarter of 2008
Product Code: e-7132-08
Consumer prices dropped in Q4 2008 compared with Q3 2008 by 0.6 %, of which regulated prices increased by 2.6% and market prices dropped by 1.5%.
The growth of regulated prices came mainly from price increase in natural gas by 10.0% and tobacco products by 5.8%, which was due to a delayed impact of an excise tax increase applicable from January 2008.
Market price decreases came mainly from a significant fall of fuel price by 15.4% and passenger cars prices by 7.3%. In 'recreation and culture' prices of package holiday dropped due to the end of the main season by 12.8%. Lower were also prices of electronic equipment for the reception, recording and reproduction of sound and pictures, photographic and cinematographic equipment and personal computers. In 'post and telecommunications' prices of mobile phones fell and so did prices of services offered by some mobile operators. Lower were also prices in 'food and non-alcoholic beverages' especially due to a price drop of fruit by 11.9%, vegetables incl. potatoes by 1.1%, milk, cheese, eggs by 1.6%, bread and cereals by 1.0%.
Consumer price indices
Q3 =100
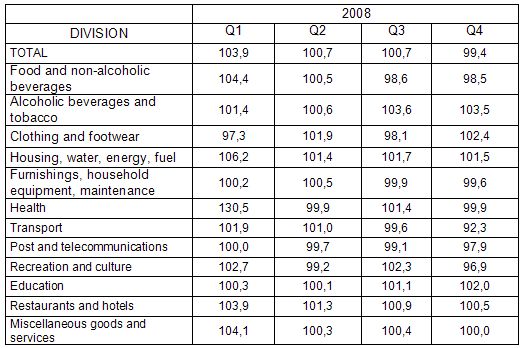
Q3 =100
In the year-on-year development the consumer prices, which increased in Q4 2008 compared to Q4 2007 by 4.7%, i.e. by 1.9% p.p. less that in Q3, a marked slowdown of growth was registered. The regulated price*) growth was 22.7% and market prices grew only by 0.4%.
A slowdown in the y-o-y growth of consumer prices in Q4 came from a price drop in 'transport' and a significant deceleration of price growth in 'food and non-alcoholic beverages'.
In transport, a notable fuel price drop was reported owing to a fall of world oil prices as a result of lower consumption caused by starting world economic crisis. In the year on-year comparison, prices of fuel were lower by 11.6% in Q4 (-22% in December). Price of Natural 95 was the lowest in December from March 2002. The average price of diesel oil was lower in March 2005. Prices of passenger cars fell by 11.5%, motorcycles by 4.7% and bikes by 7.1%. In contrast, prices in public transport went up by 11.5 %.
A deceleration of the y-o-y price growth in ' food and non-alcoholic beverages' was due to a slowdown of price growth in bread and cereals and in product group including milk, cheese, eggs where prices recorded a notable growth in Q4 2007. Prices of bread were in Q4 2008 higher by 5.4%, y-o-y, (in Q3 by 21.7%), rolls and baguettes by 4.3% (in Q3 by 27.0%), flour by 17.3% (in Q3 by 50.6%). Prices in product group including milk, cheese, eggs dropped by 2.4% (in Q3 they were 12.1% up). Prices of oils and fats increased by 3.2% (in Q3 by 18.2%). Prices of fruit, which were in Q3 higher by 4.1%, in Q4 dropped by 11.5%.
In ' housing, electricity, water and other fuels' a moderate price growth was recorded due to the natural gas price increase by 10.0% from October resulting in the y-o-y growth in Q4 to 33.9% from 27.7% in Q3. Net rentals increased by 15.0 %, of which for dwellings with regulated rentals by 22.2% and for dwellings with market rentals by 3.8 %. Prices of electricity increased by 9.5%, prices of heat and hot water by 13.2% and prices solid fuels by 14.9%. Prices of water supply and sewerage water charges were up by 8.3% and 9.1%, respectively.
The y-o-y price growth speeded up also in ' alcoholic beverages and tobacco' due to a price growth of tobacco products by 14.3% (in Q3 by 11.4 %).
In ' hotels and restaurants' the price growth owed mainly to the increase of food prices and the increase of VAT on meals provided in restaurants in January 2008. Prices of meals served in restaurants rose by 6.0%, in canteens by 8.6% and school canteens by 10.4%.
The y-o-y price drop occurred in clothing and footwear, where prices of clothes decreased by 0.7%. Despite an increase in prices of postal services from January 2008, a price decline occurred in 'post and telecommunications' owing to price decrease in mobile phones and price reductions offered by mobile phone operators.
Price increase of goods in total slowed down to 2.7% (from 5.7% in Q3 2008) and prices of services to 7.9% (from 8.1% in Q3).
Harmonized index of consumer prices in the EU27
According to preliminary data, the year-on-year increase in the average harmonized index of consumer prices (HICP) in the EU27 was 3.7% in October and 2.8% in November. Prices grew most in Latvia (by 13.7% and 11.6%). The lowest inflation was registered in Germany and Portugal (both 2.5% and 1.4%). In Slovakia the price growth slowed down from 4.2% in October to 3.9% in November. In the Czech Republic the y-o-y growth of HICP was 5.7% in October, 4.1% in November and according to preliminary results it stood at 3.3 % in December, which values are significantly bigger than the EU27 average. However, this difference in price growth squeezed significantly in the last months of 2008.
The average inflation rate in 2008 reached 6.3 %, which is markedly more than in 2007 when it stood at 2.8 %. This applies to the highest average annual inflation rate for the last ten years. The inflation rate showed a strong increasing trend from January, which ended not earlier than in the last two months in 2008. This development was influenced by many factors, including especially a considerable increase in food prices, increased VAT rate from 5 % to 9 % on some goods and services, higher excise tax on tobacco products, higher prices of energy, regulated rentals and an introduction of regulated fees in health.
The month-on-month breakdown of consumer prices in 2008 shows that a 6.3% price level increase was contributed to by the following:
- mainly by prices of housing (by 2.6 percentage point)
- the second most important contribution (1.3 p.p.) came from prices of 'food and non-alcoholic beverages'
- prices in 'alcoholic beverages and tobacco' contributed by 0.9 p.p.
- 'hotels and restaurants' contributed by 0.4 p.p.
- contribution of 'transport' and 'other goods and services' made 0.3 p.p. each
- prices in 'recreation and culture' contributed by 0.1 p.p.
- prices in furnishing, household equipment and in education reported a zero contribution to consumer price increase
- two sections of consumer basket, i.e. 'clothing and footwear' and 'post and telecommunications' pushed down the consumer price level, by 0.1 p.p. each.
Faster than in 2007 grew prices almost in all sections of consumer basket. This applied mainly to prices of housing where prices of natural gas increased by 24.3%, electricity by 9.5 %, heat and hot water by 11.7 %. Net rentals were up by 16.2 %, of which in dwellings with regulated rentals by 25.5% and in apartments with market rentals by 2.5%.
Price development was influenced also by price growth in food started already by the end of 2007 due to world price increase of crude materials and strengthened by the VAT rate increase from 5% to 9% applied from January 2008. The y-o-y growth of prices in 'food and non-alcoholic beverages' culminated in January and slowed down in the following months to show a y-o-y price drop in December. Prices of bread and cereals were higher compared to 2007 by 18.0%, prices in product group including milk, cheese, eggs rose by 11.6% and prices of vegetable oils and fats by 14.2%.
VAT rate increase from 5% to 9 % and price increase of food reflected in prices of hotels and restaurants where prices of meals increased by 6.3%, in canteens by 8,5% and in school canteens by 10.3%.
The price level increase came also from the excise tax increase on tobacco products whose prices were 15.5% up.
In 'health' the introduction of regulation fees reflected markedly.
A specific price development was reported in transport where, on one side, a price increase of transport services was recorded due to the VAT rate increase, on the other side, there was a significant drop of fuel and motor car prices in the latter half of 2008. Fuel prices in 2008 were higher than in 2007 by 3.9%, of which in Q1 by 14.3%, while in Q4 they were 11.6% down, y-o-y. Prices of transport services increased by 10.9% while this growth was observed to a great extent as soon as in January, which resulted in a significant price growth in transport in Q1 2008, which in Q4 turned into a drop, y-o-y.
The above suggests that majority of significant price wobbles showing an upward trend in inflation took place in January, which resulted to a marked y-o-y price growth (by 7.5%) in this particular month followed by a moderate slowdown (in October the growth was 6.0%). Not earlier that in November and December a significant deceleration of the y-o-y growth was reported due to a price drop in food and fuel resulting (in contrast to 2007) in a notably higher value of the average y-o-y inflation (6.3%) compared with the y-o-y inflation in December 2008 (3.6%).
__________________________
*) goods and services whose prices are partly or entirely regulated and indirect tax adjusted