Development of consumer price indices - 4. quarter of 2007
Product Code: e-7132-07
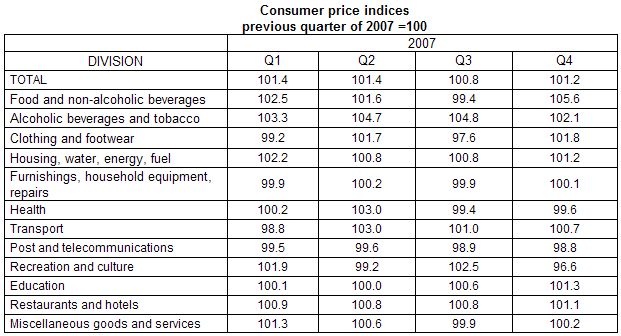
Consumer prices increased in Q4 2007 compared with Q3 2007 by 1.2% of which regulated prices by 1.5% and market prices by 1.2%.
The growth of regulated prices was attributed predominantly to a 3.2 % price increase of tobacco manufactures driven by the excise tax raise in March 2007. In 'housing, water, electricity and other fuels’ (hereinafter only ’housing’) the natural gas prices increased by 4.8%. Net rentals rose by 0.8 % of which in dwellings with regulated rentals by 1.3 %. Train fare increased by 2.8%. A contrary effect was attributed to reduced amounts paid by patients for drugs with prescription (by 2.1% less compared to Q3) as well as the drop of seasonal prices of stays at spa.
The market price development was affected especially by the price increase in ’food and non-alcoholic beverages’ in which prices of almost all kinds of food went up. Prices of bread and cereals were 11.8% up, milk by 18.4%, cheese by 14.4%, butter by 21.1% and vegetables grown for fruit by 34.8%. Prices of clothing and footwear increased due to new autumn and winter collections. Fuel prices increased by 1.4%, quarter-on-quarter, mainly as a result of automotive fuel price and LPG price increase by 7.3% and 8.9%, respectively. Prices in education increased as a result of their growth in September which showed in all months of Q4. In 'hotels and restaurants' especially prices of meals and beverages provided by restaurants were by 1.5% higher.
The market price decrease was driven mainly by the price drop in ’recreation and culture' where prices of package holiday fell by 13.7% due to the end of high season. Lower were also prices of electronic equipment for the reception, recording and reproduction of sound and pictures, photographic and cinematographic equipment and personal computers. In 'food and non-alcoholic beverages' lower were especially prices of potatoes (-19.8%), sugar (-1.6%) and some non-alcoholic beverages.
The average m-o-m growth in Q4 2007 was 0.7 % while in Q3 the growth was only 0.1%.
In the year-on-year comparison consumer prices increased in Q4 2007 compared to Q4 2006 by 4.8%, i.e. almost doubled compared to Q3 2007. The growth of regulated prices speeded up to 13.0% (from 10.2% in Q3) and market prices accelerated to 3.2% (from 1.0% in Q3).
The y-o-y growth came mainly from prices of food and non-alcoholic beverages which recorded a significant speed-up in Q4. Prices of bread and cereals were higher by 15.2% on average (by 2.9% in Q3) of which prices of bread increased by 21.8% and prices of baguettes and rolls by 19.6%. Prices of milk rose by 30.4% (in Q3 by 11.3%), cheese by 21.2% (by 5.4% in Q3), butter by 29.7% (by 7.2% in Q3). Seasonal prices of fruit went up by 18.8% and prices of vegetables incl. potatoes dropped by 5.3% in Q3 and in Q4 they reported a 2.6% increase. A price growth was recorded for most kinds of food in Q4. Consumer prices of food went up due to the agricultural producer price growth coming from a bigger world demand for foodstuff.
In ' alcoholic beverages and tobacco' in all months of Q4 prices of tobacco manufactures continued to grow, however, the growth was markedly slower compared to Q3. The average m-o-m rate of growth of prices in tobacco manufactures was 0.4% in Q4 (2.9% in Q3). Prices of cigarettes were higher, y-o-y, by 28.4%. In Q4 an acceleration of price growth of bottled beer was recorded resulting into a 4.9% price increase.
In ' housing, electricity, water and other fuels' the price growth speeded up mainly due to the increase of net rentals by 9.7% of which in dwellings with regulated rentals by 17.1% while in dwellings with market rentals a 0.2% price drop was recorded. Prices of natural gas increased in October, m-o-m, by 4.7% while in October 2006 they dropped by 5.5%, m-o-m, which resulted into a turnover in the y-o-y price level of natural gas. In Q3 prices of natural gas dropped by 6.6% and in Q4 they recorded a 3.6% growth. Prices of electricity remained higher by 7.9%. Similarly, the price growth in water supply and sewerage collection charges remained the same in the last three quarters, i.e. 6.7% and 5.5%, respectively. Prices of solid fuels were 18.7% up and prices of heat and warm water by 3.7%.
In transport the y-o-y price development changed; a price fall in Q3 turned into a price growth in Q4. This was especially due to fuel prices which were 8.5% up in Q4 2007 while in Q3 2007 they were 2.6% down, y-o-y. This was attributed to a different fuel price development in Q4 2007 (average growth rate was 1.2%) and in Q4 2006 (average m-o-m rate of decline was 3.1%). Fuel price growth came from a marked increase of automotive fuel price with an average m-o-m growth rate 3.6% in Q4. Lower were prices of cars, motorcycles and bicycles. Prices of transport services increased by 1.8% especially due to the train fare increase by 8.5%, m-o-m, and by 5.3% in quarterly y-o-y comparison.
As it is clear from the graph the y-o-y growth of consumer prices of fuel was preceded by a significant growth of the world crude oil prices as well as of industrial producer prices of refined petroleum products.
In ' recreation and culture' a change in the price development was recorded; the drop in Q3 turned in an insignificant growth in Q4 mainly due to seasonal prices of package holiday which were in Q3 2007 by 0.7% lower, y-o-y, while in Q4 they were 0.6% up. A price drop continued for prices of electronic equipment for the reception, recording and reproduction of sound and pictures, photographic and cinematographic equipment and personal computers.
In ' education' as the new year started a month-on-month price increase was recorded in September (+1.8%) which was, however, lower compared with September 2006 (+2.6%) and resulted into a slow-down of the y-o-y growth partly in Q3 and entirely in all months of Q4 2007.
In 'hotels and restaurants' the growth of food prices resulted in an increase of prices of meals provided by restaurants by 3.2%, in canteens by 3.1% and school canteens by 2.7%.
In ' post and telecommunications' the y-o-y price decrease was reported which in Q4 became more profound. This development came from commercial price reductions offered by mobile operators.
Price increase of goods in total speeded up to 5.7% (from 2.5% in Q3) and prices of services to 3.4% (from 2.6% in Q3).
Harmonized index of consumer prices in the EU27
According to preliminary data, the year-on-year increase in the average harmonized index of consumer prices (HICP) in the EU27 was 2.7% in October and 3.1% in November 2007. Prices grew most in Latvia (by 13.2% and 13.7%) and in Bulgaria (by 10.6% and 11.4%). The lowest inflation was registered in the Netherlands (1.6% and 1.8%). In Slovakia the price growth was 2.4% and 2.3%, respectively. In Germany the HISCP in the above months was 2.7% and 3.3%. In the CR the y-o-y HICP was 4.0% in October, 5.1% in November and according to preliminary results it speeded up in December to 5.5% which are above-the-average values compared with the EU27.
Assessment of the year 2007
The month-on-month development of consumer price in 2007 was affected by administrative changes in prices including the following:
- price increase in tobacco manufactures in all months in 2007 due to the delayed effect of the excise tax increase from April 2006 and another increase of excise tax which was reported from March 2007
- gradual increase of net rentals in dwellings with regulated rentals over the year 2007
- increase in prices of electricity by 7.9%, net rentals by 4.5%, water supply by 6.6%, sewerage collection charges by 5.5% and TV concession fee by 20.0% from January
- increase in social care prices by 2.8% in January and by 12.0% in February due to an amendment to the law on providing social service
- decrease of natural gas prices by 4.2% from January and their increase in April, July, September and October ( by 1.4%, 1.6%, 0.2% and 4.7%, respectively)
- increase of fees of some educational services from September
- price increase in transport via railway by 8.5% since December 2007
At price markets the month-on-month development was affected mainly by the following:
- fuel prices which increased most in April and May (in both months identically by 4.3%)
- food prices whose price wobbles in both directions were affected by seasonal prices of fruit, vegetables, potatoes and in Q4 by a marked price increase in most kinds of food
- seasonal prices of domestic holiday and holiday abroad and stays at spa whose prices show cyclic changes contributing thereby to an increase or decrease of the m-o-m inflation
- moderate drop of prices of devices and household appliances and electronic equipment for the reception, recording and reproduction of sound and pictures.
The average m-o-m growth rate of consumer prices in 2007 was 0.4% of which for regulated prices the growth rate was 1.0% and for market prices 0.3%.
Year-on-year development
The average y-o-y inflation rate in 2007 reached 2.8%, i.e. 0.3 percentage point higher compared to 2006. Since January 2007 the inflation rate showed a downward trend (in September it was 2.0%) and a sharp raise occurred in the last three months of 2007 mainly due to the food price turmoil.
The breakdown of the y-o-y increase of consumer prices in 2007 shows that a 2.8% price growth in 2007 was contributed to by the following:
- equal contribution (0.8 p.p.) came from prices in food and non-alcoholic beverages, alcoholic beverages and tobacco, housing
- prices in 'restaurants and hotels' contributed by 0.2 p.p.
- the same contribution (0.1 p.p.) showed prices in health and miscellaneous goods and services
As it is clear from the above a decisive contribution to the level of the y-o-y inflation came from three sections of consumer basket. The year on year growth of prices in 'food and non-alcoholic beverages' ranged in September between 2-5%, in December it culminated at 11.2%. Prices of tobacco manufactures were due to their continuous growth (coming from higher excise tax) 29.0% up in December, the average growth in 2007 was 18.4%. Prices in 'housing, water, electricity and other fuels’ grew slower compared to 2006 due mainly to prices of natural gas which were in 2007 5.0% down on average compared to 2006. Prices of electricity increased by 7.9%, heat and warm water by 2.6%. Net rentals were by 7.3% higher of which in dwellings with regulated rentals by 13.0% and in dwellings with market rentals by 0.5%.