Development of consumer price indices - 4. quarter of 2004 and year 2004
Product Code: e-7132-04
Development of consumer price indices in the fourth quarter of 2004 and 2004
Analysis of Q4 2004
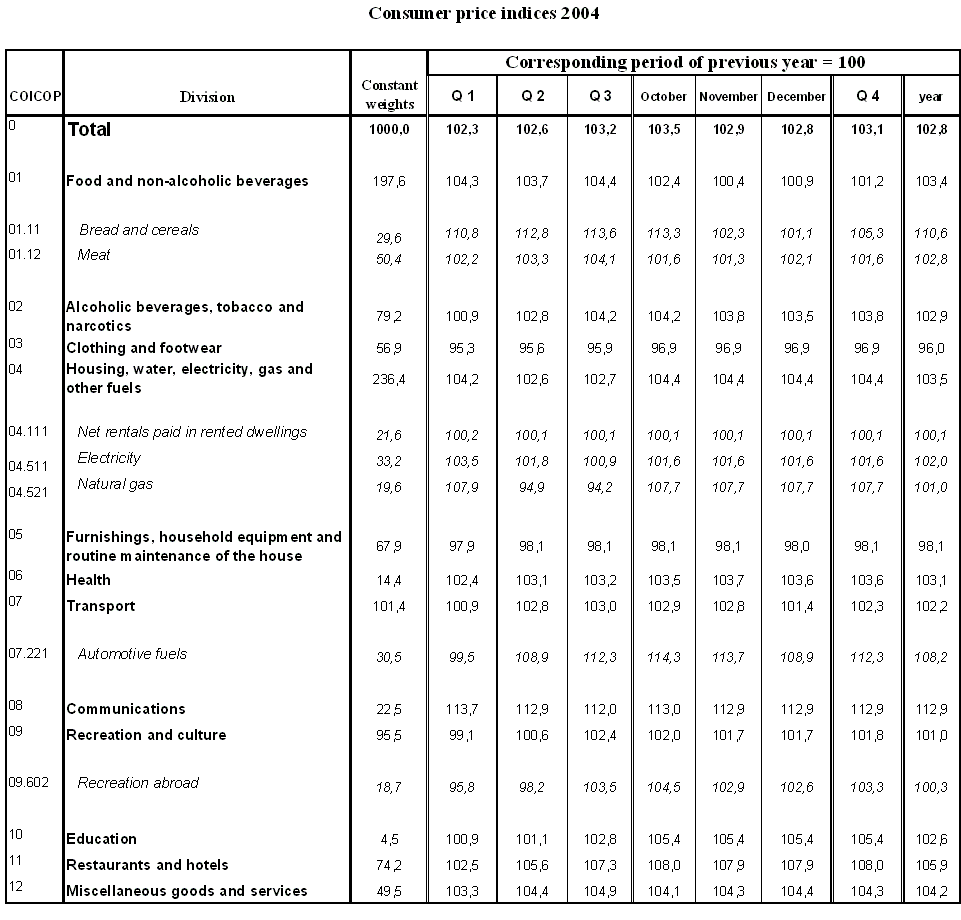
Consumer price level increased year-on-year by 3.1% in the fourth quarter of 2004 , which is only by 0.1 percentual point less than in the third quarter of 2004. Despite about the same level of the total consumer price level in both the quarters, price development within the consumer basket differed. For most COICOP divisions of the consumer basket, rather distinctive price fluctuations both upwards and downwards occurred in the fourth quarter. Development of the price level was influenced in the fourth quarter especially by the slowdown of price growth of food and non-alcoholic beverages and, on the contrary, acceleration of price growth of housing.
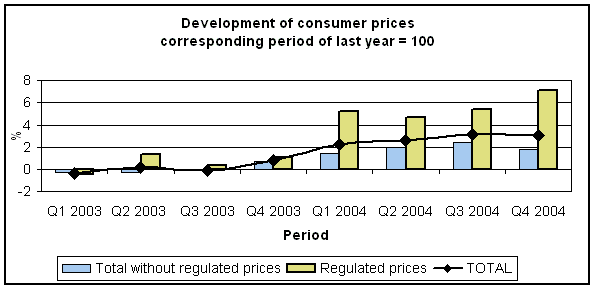
Related to that was deceleration of growth of market prices, which increased by +1.8% (+2.5% in the third quarter) and acceleration of growth of regulated prices to +7.1% (from +5.5% in the third quarter). Share of market prices in the total increment of consumer prices in the fourth quarter of 2004 was 1.4 percentual points; share of regulated prices was 1.7 percentual points.
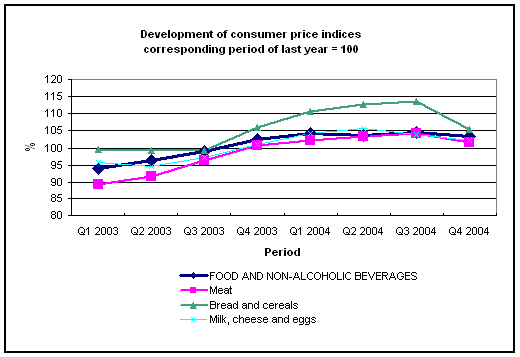
Deceleration of price growth of food and non-alcoholic beverages in the fourth quarter of 2004 was caused especially by a marked reduction of price growth of bread and cereals, prices of which have increased in November 2003 and until October 2004 were higher y-o-y by more than ten percent. Moderation of price growth was observed also for other kinds of food. Food and non-alcoholic beverages thus became a division with the lowest price growth (except for two divisions of the consumer basket, in which prices were decreasing y-o-y). Prices of bread and cereals were higher by +5.3% (+13.6% in the third quarter), meat +1.6% (+4.1% in the third quarter), milk, cheese and eggs by +2.2% in average (+3.9% in the third quarter), oils and fats by +3.0% (+5.2% in the third quarter), fruit by +3.0% (+5.1% in the third quarter). Decrease of prices of fresh vegetables dropped to -14.8% (from -8.9% in the third quarter) and prices of potatoes were by a half lower than in the corresponding period of last year.
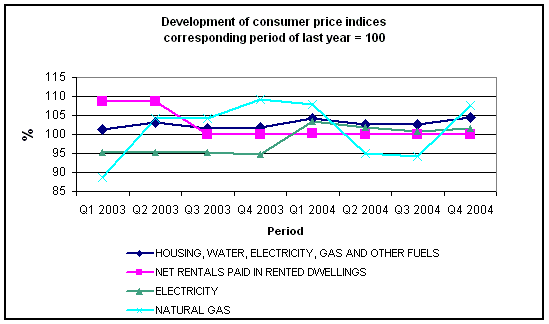
Acceleration of price growth in ‘ housing, water, electricity, gas and other fuels ’ has been influenced primarily by an increase of prices of natural gas since October 2004. It resulted in the price increase of natural gas by +7.7%, while in the third quarter the prices were by -5.8% lower y-o-y. Development of prices of housing was influenced also by an increase of the cost of housing in cooperative dwellings by +5.6%, water rate by +5.3%, sewage collection rate by +5.8%, and refuse collection by +6.6%.
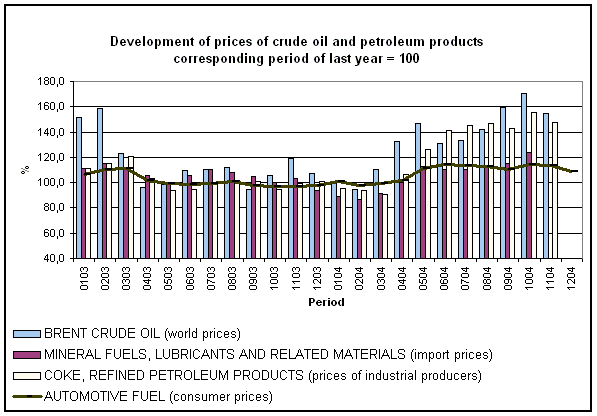
In transport , increase of automotive fuel prices culminated in October and in the following two months their growth decelerated. In average for the fourth quarter, prices of automotive fuel (the same as in the third quarter) increased by +12.3%. Similar development was observed also for world prices of crude oil and prices of domestic producers of refined petroleum products, which started to decrease in November after a marked increase in October. Prices of transport services increased by +3.4%, of which +9.5% was in urban public transport by bus. Reduction was recorded in prices of both new and second-hand passenger cars.
In recreation and culture , prices of package holidays were higher by +3.0%, recreational services by +7.6% and newspapers and magazines +5.4%. Decline in prices of equipment for the reception, recording and reproduction of sound and pictures continued.
In education , prices reflected September price increase related to the opening of the new school year.
Similarly, in restaurants and canteens , price growth acceleration in the fourth quarter was mainly a result of a price increase in school catering and accommodation, which took place in September. Food prices in restaurants were higher by +8.0% and food prices in canteens by +11.5% especially due to the higher VAT that was introduced in May 2004.
Marked growth of prices in communications was caused by VAT change for public telecommunication services. Further reduction occurred at prices of mobile phones.
In miscellaneous goods and services , price growth was caused primarily by price increase in personal care by +17.0% (influence of VAT increase), insurance by +4.6% and financial services by +7.3%.
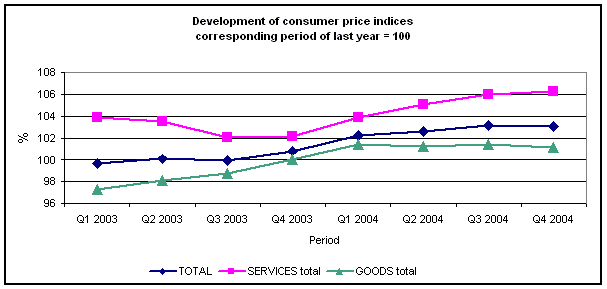
Prices of goods in total increased by +1.2% and prices of services by +6.1%.
Analysis of 2004
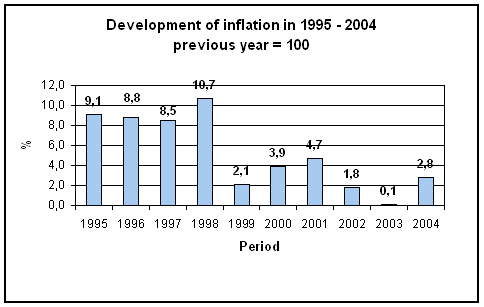
Average year-on-year inflation rate in 2004 reached 2.8%, which is by 2.7 percentual points more than in 2003 (inflation rate was almost zero in 2003). Taking into account the last five years, the amount of inflation in 2004 was rather average.
Development of consumer prices in 2004 was influenced especially by the increase of VAT and excise taxes from January and VAT changes both upward and downward for services and goods since May 2004. In January, VAT rate increased from 5 to 22% mainly at public telecommunication services and excise taxes increased at automotive fuel, spirits and tobacco products. Another VAT change, taking effect from 1 May 2004, consisted in the increase from 5 to 19% for many services and, on the contrary, a decrease from the 22 to 19% rate for most of non-food goods and public telecommunication services. The VAT change upwards resulted in an increase of prices especially in catering services and personal services; VAT decrease was fully reflected primarily in prices of electricity, natural gas and public telecommunication services. Prices development was influenced also by administrative changes of prices, especially those of energies and other services related to housing.
In 2004, prices influenced by administrative changes increased by +5.7% (+0.6% in 2003) and market prices +2.0% (zero growth in 2003). According to the CZSO calculation, the share of changes of administrative prices in total increment of consumer price level was 1.3 percentual points, of which the influence of higher excise taxes was 0.3 percentual points and the influence of VAT changes was 0.5 percentual points. Influence of market prices was 1.5 percentual points. Public telecommunication services participated in the price growth due to VAT substantially as their VAT rate changed as from January 2004 from 5 to 22% (followed by a reduction to 19% as from May). VAT changes from May, which were both upward and downward, participated in the growth of price level by about 0.1 percentual point according to the CZSO calculation. A marked increase of prices took place from May in catering services, hairdressing salons and personal grooming establishments, repair and hire of clothing, repair and hire of footwear. In total, prices of services increased by +5.3% and prices of goods in total by +1.3%. Price development in both these groups was influenced by VAT changes only partially, as both contain rather important sets of items, for which the VAT change was not applied (e.g. rental, transport services, food, medical products, appliances and equipment).
From breakdown of y-o-y increment of consumer prices in 2004, which includes a combination of the amount of price growth and weight of individual COICOP divisions of the consumer basket, it results that what showed the biggest influence on the price level increase in 2004 (by +2.8%) were prices of housing. Their share was almost 1.0 percentual point. Prices of food and non-alcoholic beverages increased price level by +0.6 percentual points and prices of restaurants and hotels by +0.4 percentual points. Growth of prices in communications was reflected in the increase of the total price level by +0.3 percentual points and 0.2 percentual points were added by prices of each of the following COICOP divisions: alcoholic beverages, tobacco, transport, and miscellaneous goods and services. Prices in health and recreation and culture had the smallest positive influence (0.1 percentual point). Decrease of prices in clothing and footwear and furnishings, household equipment had an anti-inflation influence; their influence on the decrease of the price level was –0.2 and –0.1 percentual points.
Prices of housing recorded growth especially in the first quarter as a result of the price increase of natural gas and electricity. In the second and third quarter, their growth decelerated due to VAT reduction for both the items and as for natural gas also thanks to the decrease of its price since April. That led to a y-o-y decrease of natural gas prices by more than 5 percent. In the fourth quarter, natural gas prices increased since October by +11.0% m-o-m and +7.7% y-o-y. In average for 2004, natural gas prices increased by +1.0% and prices of electricity by +2.0%. Growth of price level of housing was influenced mainly by an increase of the cost of housing in cooperative dwellings (+5.2%), water rate (+5.0%), sewage collection charges (+5.8%) and refuse collection (+6.5%) in 2004.
Price level of food and non-alcoholic beverages was influenced during most of the months of 2004 by an increase of prices of bread and cereals, which took place already in November 2003. Despite deceleration of price growth in the end of the year, prices of bread and cereals increased in average by +10.6%, meat +2.8%, milk, cheese and eggs in average by 3.9%, oils and fats +4.1% and sugar +23%. Lower than in 2003 were especially prices of fresh vegetables (-7.7%).
In restaurants and hotels , due to VAT increase, food prices in restaurants increased by +6.3% and food prices in canteens +7.3%.
The most distinctive price growth occurred in communications , in which prices of public telecommunication services increased due to VAT rate change by +14.5%.
In alcoholic beverages, tobacco , prices of tobacco products increased by +5.6% mainly due to an increase of the excise tax since January. The excise tax increase started to be reflected in prices of cigarettes no sooner than during the second quarter (until that time the stock was being sold for old prices).
Development of prices in transport was influenced primarily by automotive fuel prices that increased by +8.2%. Prices of automotive fuel underwent a rapid development in 2004; while in the first quarter they decreased y-o-y, in October they reached the highest y-o-y price growth since November 2000. This development corresponded with the development of crude oil prices on world markets, development of prices of domestic producers of coke and refined petroleum products and import prices of mineral fuels, mineral oils. Prices of transport services increased by +3.4%. Prices of both new and second-hand passenger cars decreased.
In ‘ miscellaneous goods and services ’ prices of personal services increased by +15.5% due to VAT increase. Prices of financial services increased markedly, too, by +12.2% and administrative and other fees by +13.9%.
A long-term price decrease in ‘ clothing and footwear ’, ‘ furnishings, household equipment and routine maintenance of the house ’ caused decreasing of price level; it was a result of a long-term slight decreasing of prices but also VAT decrease for clothing, footwear, home appliances and other household utensils.
HICP
Harmonized index of consumer prices in the EU25
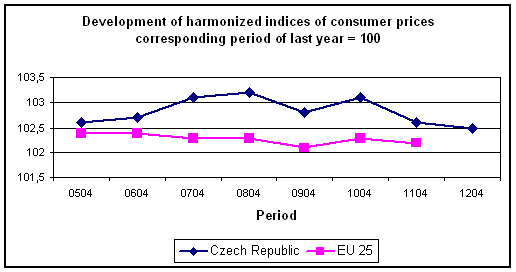
According to preliminary data, the average y-o-y increase of the harmonized index of consumer prices (HICP) in the 25 EU Member States reached 2.2% in November , which is by 0.1 percentage point less than in October. Most of the Member States recorded faster HICP growth than the EU average. The highest growth of prices was observed in Latvia (+7.2%) and Slovakia (+6.0%). The lowest price growth was in Finland (+0.2%), Denmark (+1.0%) and Sweden (+1.1%). In the Czech Republic, the y-o-y price growth reached +2.6% in November and slowed down to +2.5% in December.
