Development of consumer price indices - 3. quarter of 2007
Product Code: e-7132-07
Consumer price indices in the third quarter of 2007
Consumer prices increased in Q3 2007 compared with Q2 2007 by 0.8%, which is less than in the pervious two quarters of 2007. Regulated prices went up by 2.8% and market prices by only 0.3%.
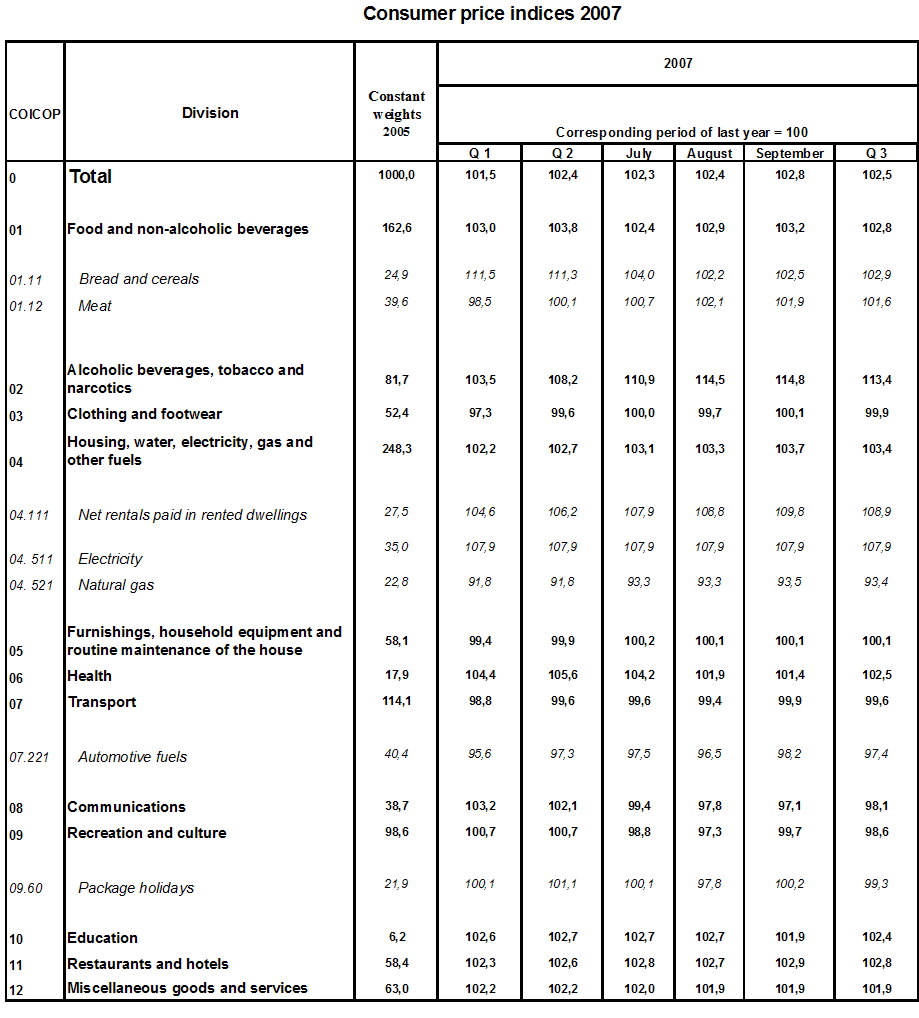
The growth of regulated prices was attributed predominantly to a 8.9 % price increase of tobacco products driven by the excise tax raise in March 2007. In 'housing, water, electricity and other fuels’ (hereinafter only ’housing’) the natural gas prices increased by 1.7%. Net rentals rose by 2.6 % of which in dwellings with regulated rentals by 4.2 %. A contrary effect was attributed to reduce amounts paid by patients for drugs with prescription (by 4.8% less compared to Q2).
The market price development was affected especially by the price increase in ’recreation and culture’ in which prices of package holidays were 13.5% up due to their seasonal increase in July and August. Fuel prices increased, quarter-on-quarter, by 2.5% despite their modest m-o-m drop in the last two months. In ’hotels and restaurants’ higher were particularly prices of accommodation and meals in restaurants (by 1.3% and 0.8%, respectively). Prices of educational services rose as well responding to their growth in September. In 'food and non-alcoholic beverages' higher were mainly prices of meat (2.3%), milk, cheese and eggs (2.6%) oils and fats (2.5%) and fruit (1.1%).
The market price decrease was driven mainly by the price drop in ’clothing and footwear' due especially to sales of summer kinds of clothing and footwear. Prices in ’post and telecommunications’ decreased as a consequence of lower roaming and domestic calls charges provided by some operators. Lower were also prices of electronic equipment for the reception, recording and reproduction of sound and pictures, photographic and cinematographic equipment and personal computers. In 'food and non-alcoholic beverages' lower were especially prices of vegetables incl. potatoes (-17.9%).
The average m-o-m growth in Q3 2007 was 0,1 %, while in Q1 the growth was 0.5% and the same was reported for Q2.
Consumer price indices
Q2 2007 =100
DIVISION | Q1 2007 | Q2 2007 | Q3 2007 |
| TOTAL | 101,4 | 101,4 | 100,8 |
| Food and non-alcoholic beverages | 102,5 | 101,6 | 99,4 |
| Alcoholic beverages and tobacco | 103,3 | 104,7 | 104,8 |
| Clothing and footwear | 99,2 | 101,7 | 97,6 |
| Housing, water, energy and other fuels | 102,2 | 100,8 | 100,8 |
| Furnishings, household equipment, repairs | 99,9 | 100,2 | 99,9 |
| Health | 100,2 | 103,0 | 99,4 |
| Transport | 98,8 | 103,0 | 101,0 |
| Post and telecommunications | 99,5 | 99,6 | 98,9 |
| Recreation and culture | 101,9 | 99,2 | 102,5 |
| Education | 100,1 | 100,0 | 100,6 |
| Restaurants and hotels | 100,9 | 100,8 | 100,8 |
| Miscellaneous goods and services | 101,3 | 100,6 | 99,9 |
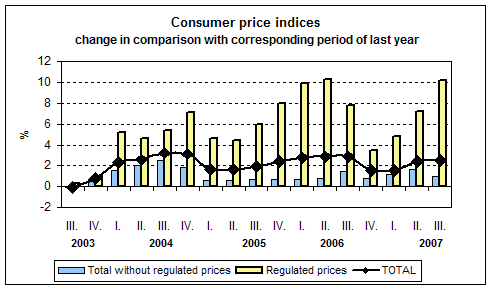
In the year-on-year comparison consumer prices increased in Q3 2007 compared to Q3 2006 by 2.5%, i.e. by 0.1 p.p. more than in Q2 2007. The growth of regulated prices speeded up to 10.2% (from 7.2% in Q2) and of market prices slowed down to 1.0% (from 1.6% in Q2).
Acceleration of the y-o-y growth was recorded mainly for prices in alcoholic beverages, tobacco and housing. By contrast, mainly in food and non-alcoholic beverages, health, education, post and telecommunications, recreation and culture, a slow-down was recorded.
Acceleration of the y-o-y growth recorded mainly in prices of alcoholic beverages and tobacco continued in all months of Q3 due to higher excise tax which finally resulted into a 24.5% price increase. Average m-o-m growth rate of tobacco products was in Q3 2.9% (2.3% in Q2).
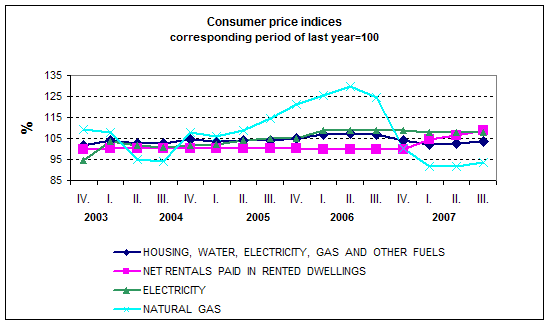
In ' housing, electricity, water and other fuels' the price growth speeded up mainly due to the increase of net rentals by 8.9% of which in dwellings with regulated rentals by 15.6% while in dwellings with market rentals no price change took place compared with 2006. Prices of natural gas increased in July, m-o-m, by 1.6% and in September by 0.2% which resulted into the y-o-y slowdown of natural gas price drop from 8.2% in Q2 to 6.6% in Q3. Prices of electricity remained higher by 7.9%. Similarly the price growth in water supply and sewerage collection charges remained the same in both quarters, i.e. 6.7% and 5.5%, respectively. Prices of solid fuels were 16.4% up.
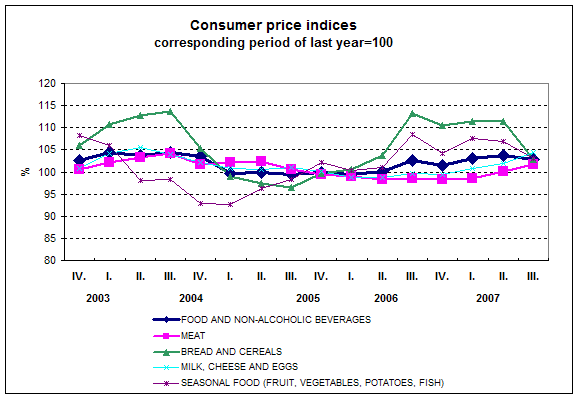
In ' food and non-alcoholic beverages' a decelerated price growth owed mainly to the seasonal price drop of vegetables incl. potatoes by 5.3%. This development came mainly from potato prices which in all months of Q3 were falling markedly. The y-o-y slow-down of price growth was reported for bread and cereals the prices of which were, on average, higher by 2.9% (by 11.3% in Q2) reflecting their increase in Q3 2006. All the same, prices of bread and flour increased by 8.4% and 20.0%, respectively, while pastry goods and cakes were by 0.7% cheaper. Prices of poultry, fresh milk and fruit went up by 12.2%, 11.3% and 13.0, respectively.
In ' health' a decelerated price growth was reported due to the reduced amount paid by patients for drugs which in Q3 was 3.9% up (9.4% up in Q2).
In education as the new year started a month-on-month price increase was recorded in September (+1.8%) which was, however, lower compared with September 2006 (+2.6%) and resulted into a slow-down of the y-o-y growth in September and thereby also in Q3 2007.
In ' in post and telecommunications' a reversal was recorded in price development when prices dropped from a 2.1% increase in Q2 to 1.9% in Q3. This development owed both to the end of commercial price reductions in public telecommunication services last year and lower roaming and domestic calls charges offered by some mobile operators in August and September 2007.
In ' recreation and culture' a change in the price development was recorded when the growth in Q2 turned into the drop in Q3. This was especially due to an increase of seasonal prices of package holidays, which like in the previous years showed, m-o-m, a marked growth, in July and August, and a significant decline in September. These wobbles resulted into the average y-o-y price-drop of package holidays in Q3 2007(-0.7%). Compared with 2006, lower were prices of electronic equipment for the reception, recording and reproduction of sound and pictures, photographic and cinematographic equipment and personal computers.
In transport the y-o-y price development was in Q3 the same as in Q2 . This was especially due to fuel prices which were 2.6% down, y-o-y, i.e. almost like in Q2 2007. This was attributed to an identical fuel price development in Q3 2007 and in Q3 2006 (average m-o-m drop rate was 0.1%). Lower were also prices of cars, motorcycles and bicycles. Prices of transport services increased by 1.4%.
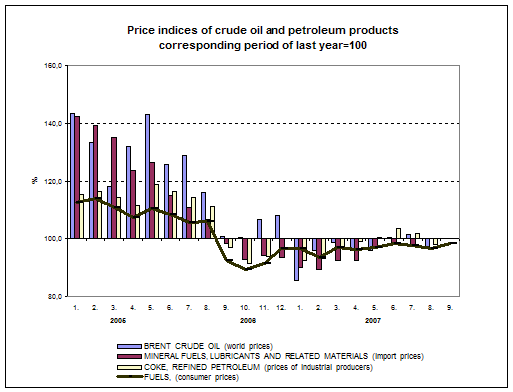
As it is clear from the chart, y-o-y development of consumer prices of automotive fuel corresponded with the development of Brent crude oil world prices, import prices of 'mineral fuels, lubricants and related materials' and prices of industrial producers of refined petroleum products.
Price increase of goods in total accelerated to 2.5% (from 2.1% in Q2), while the price growth of services slowed down to 2.6% (from 3.1% in Q2).
Harmonized index of consumer prices in the EU27
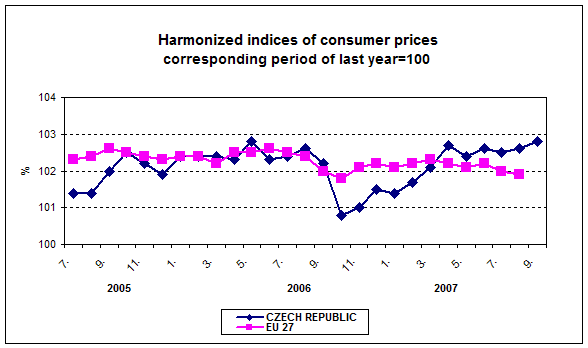
According to preliminary data, the year-on-year increase in the average harmonized index of consumer prices (HICP) in the EU27 was 2.0% in July and 1.9% in August 2007. Prices grew most in Latvia (by 9.5% and 10.2%), Hungary (by 8.3% and 7.1%) and in Bulgaria (by 6.8% and 9.3%). The lowest inflation was registered in Malta where a 0.2% drop in July turned into a 0.6% increase in August, and then in Denmark (1.1% and 0.9%). In Slovakia the price growth in July and August was 1.2% and ranked among the lowest within the EU. In Germany a 2.0% increase of the HISCP was reported for both months. In the CR the y-o-y HICP was 2.5% in July, 2.6% in August and according preliminary results it speeded up in September to 2.8%, which are above-the-average values compared with the EU27.
