Development of consumer price indices - 3. quarter of 2004
Product Code: e-7132-04
Development of consumer price indices in the third quarter of 2004
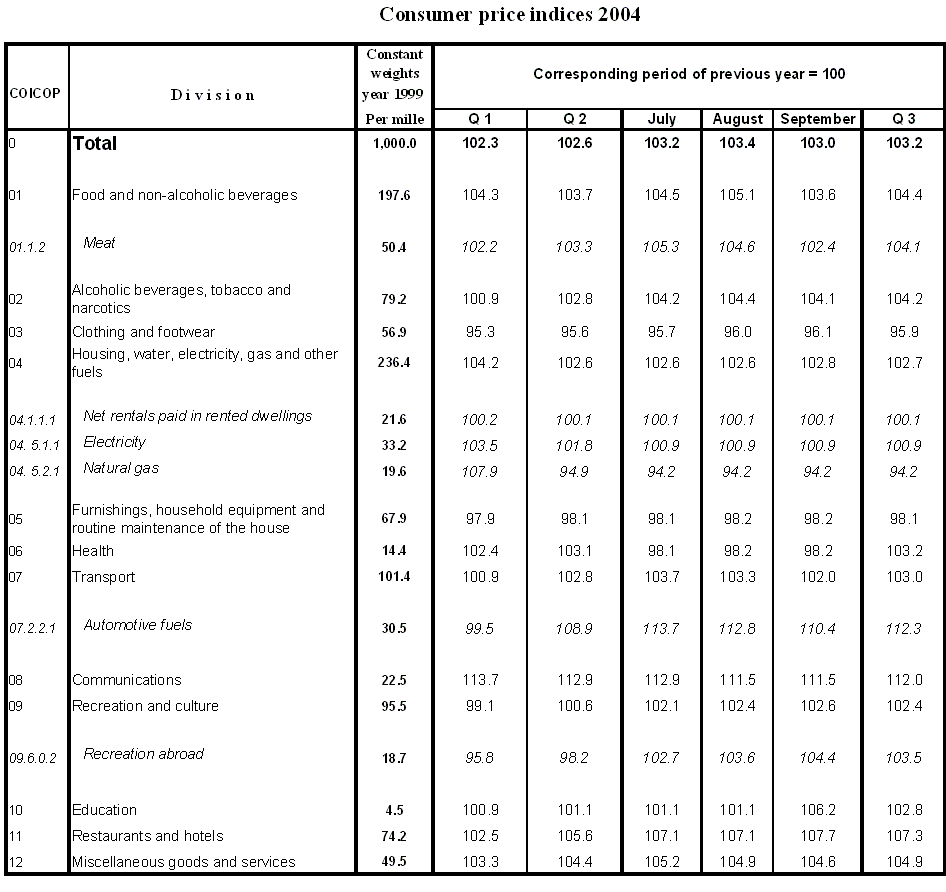
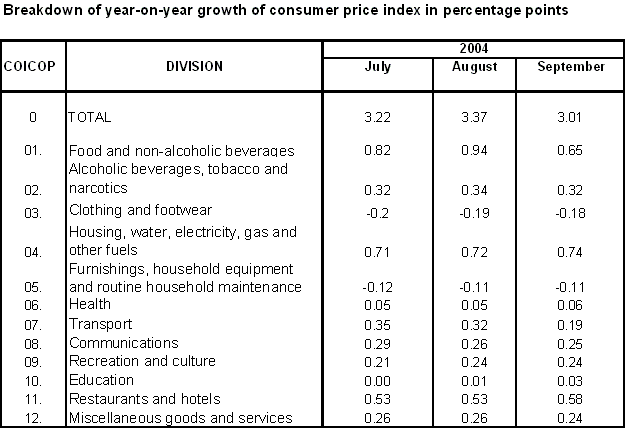
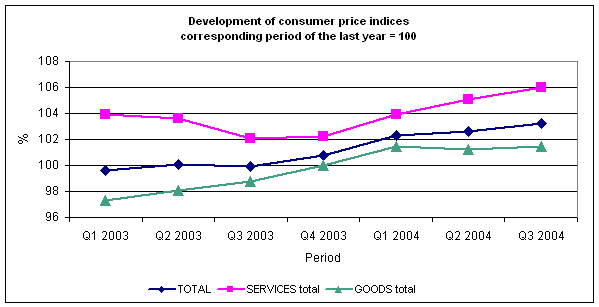
Consumer prices level increased in the third quarter of 2004 by 3.2% y-o-y , which is by 0.6 percentual point more than in the second quarter of 2004 and the most for the last two and half years (since the first quarter of 2002). The price growth acceleration, although in the different scope, occurred at all COICOP divisions of the consumer basket with the exception of ‘post and telecommunication’. The biggest contributors to the growth acceleration of the overall price level were (with regards to their weight in the consumer basket) prices of food and non-alcoholic beverages and also prices in ‘alcoholic beverages, tobacco‘, ‘recreation and culture’, ‘education’, and ‘restaurants and hotels’.
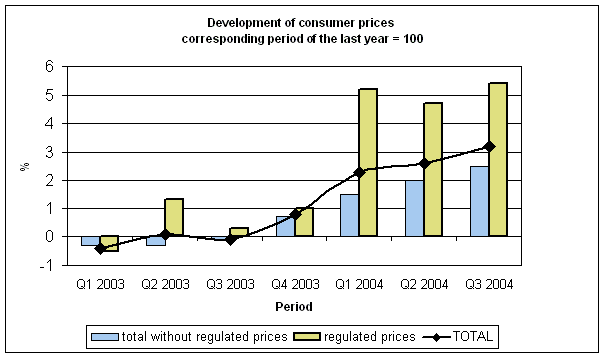
Market prices and regulated prices participated in the total increment of consumer prices in the third quarter of 2004 with 1.9 and 1.3 percentual points, respectively. Market prices increased by 2.5% (in the second quarter by 2.0%), regulated prices by +5.4% (in the second quarter +4.7%).
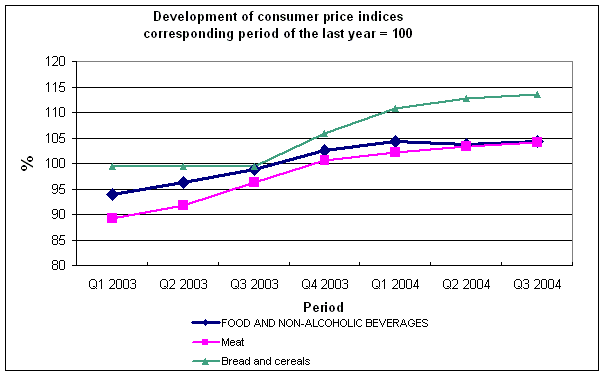
Prices of food and non-alcoholic beverages during all months of the third quarter were decreasing m-o-m due to seasonal price decrease of fruit, vegetables and potatoes; however, this decrease was less marked than in 2003 with the exception of September. That resulted in acceleration of y-o-y dynamics of price growth in July and August. In these two months, also price increase of meat and sugar influenced the price increase of food. In September, food price growth slowed down as (unlike in the last year) seasonal prices of food continued to decrease and growth of meat prices stopped. In the third quarter, prices of bread and cereals were higher y-o-y by 13.6% (prices of rolls and bagels increased by 32.7%), meat by 4.1% (pork +10.2%), milk, cheese, and eggs in average +3.9%, oils and fats +5.2%, fruit +5.1%, and sugar +40.7%. Lower were especially prices of fresh vegetables (-8.9%) and potatoes (-24.9%).
In ‘ alcoholic beverages, tobacco ’ prices of tobacco products increased by 8.9% as a result of the excise tax increase in January.
In ‘ recreation and culture ‘ seasonal prices of package holidays significantly increased m-o-m in July and August (similarly as in the previous years) and slumped in September. Resulting from these movements was an average y-o-y price increase of recreational stays in the third quarter of 2004 by 3.9% (recreational stays abroad +3.5% and domestic recreational stays +5.1%). Prices of recreational services also increased (+6.2%) as well as cultural services (+5.6%) and newspapers and magazines (+6.2%). Prices of equipment for the reception, recording and reproduction of sound and pictures remained lower and their long-term decrease continued.
Price growth of ‘ education ‘ was influenced by an increase of prices of educational services in September, which occurred in relation to the start of the new school year.
Similarly, in ‘ restaurants and canteens ‘ prices increased at school catering and accommodation. Prices of meals in restaurants were higher by 7.9%, especially due to the higher VAT, which was introduced in May 2004.
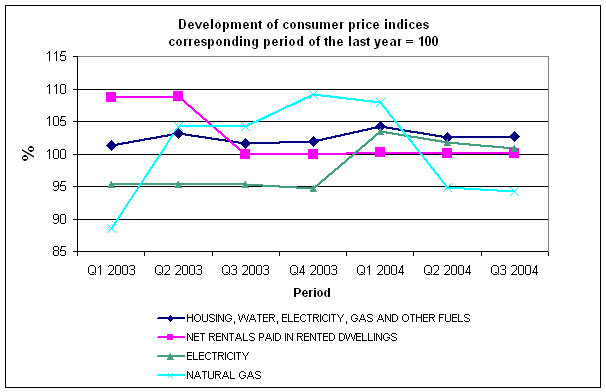
Price growth at ‘ housing ‘ was in the third quarter almost the same as in the second quarter and was for the first time higher than growth of the average price level. This development was influenced by the stability of regulated prices of rentals, price decrease of natural gas (-5.8%), price increase of electricity only by 0.9% and heat by 1.9%. Price growth at ‘housing‘ was influenced especially by an increase of the cost of housing in cooperative dwellings and owner-occupied dwellings by 5.3% and 5.5%, respectively, and an increase of prices of water supply (+5.1%), sewage collection (+5.8%) and refuse collection (+6.4%).
Distinctive price growth at ‘ post and telecommunication ‘ was caused by changes of VAT rate for public telecommunication services. Prices of mobile phones continued to decrease. Price growth of ‘ miscellaneous goods and services ‘ was caused mainly by an increase of prices of personal services by 17.4% (influence of VAT increase), insurance by 4.6% and financial services by 14.8%.
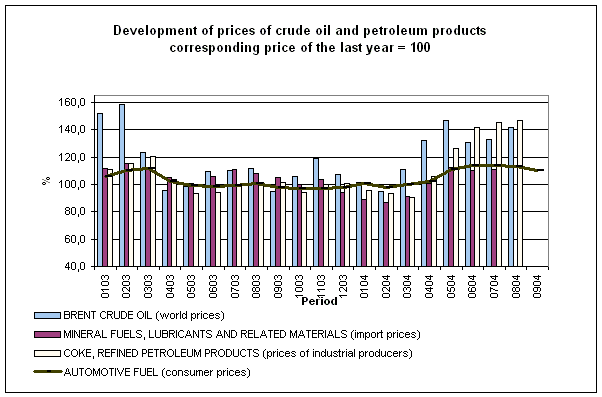
Prices of goods, total increased by 1.5%, prices of services by 6.0%. Price growth of services was influenced especially by the VAT increase since May 2004, which was reflected in all the three months of the third quarter (unlike the second quarter). Prices of goods, total increased mainly in July and August due to the price increase especially at food and automotive fuel.
Harmonized index of consumer prices in the EU25
The average year-on-year increment of the harmonized index of consumer prices (HICP) for the EU25 reached according to the preliminary data 2.3% in August (the same as in July). Most of the Member States recorded faster HICP growth than the EU average. In new Member States, the price growth was (with the exception of Lithuania) above the EU average from 2.5% in Malta up to 7.8% in Latvia. From the original 15 Member States of the EU, the biggest price growth was in Luxembourg (+3.6%) and the lowest in Finland (+0.3%). In the Czech Republic, the y-o-y price growth reached 3.2% in August and it slowed down to 2.8% in September.
