Development of consumer price indices - 2. quarter of 2008
Product Code: e-7132-08
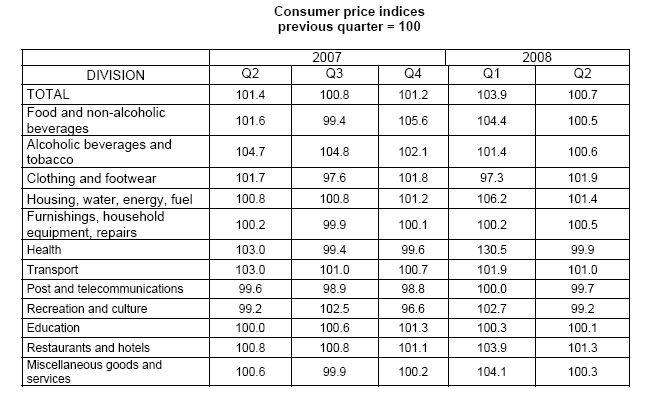
Following a marked increase in Q1 the consumer price development in the next months was stable. Consumer prices grew in Q2 2008 compared with Q1 2008 by 0.7% of which regulated prices increased by 0.9% and market prices by 0.7%.
The growth of regulated prices came mainly from 'housing, water, electricity and other fuels’ (hereinafter only 'housing') where prices of natural gas increased by 2.9% and prices of heat and hot water by 1.2%. Net rentals increased by 0.9%, water supply by 1.4% and sewerage collection charges by 1.6%.
The market price development was affected especially by price increase in clothing (+1.5%) and footwear (+3.0%), which came primarily from higher prices of new seasonal kinds of clothes and shoes. Prices of meals and beverages provided in restaurants were 1.2% up and prices of accommodation services increased by 2.7%. Fuel prices, which increased by 3.5%, continued to grow. In the division 'alcoholic beverages and tobacco' prices of spirits and wine increased both by 1.4%. In food products namely prices of flour went up by 12.1%, rice by 12.9%, citrus fruit by 19.3%, potatoes by 24.4% and other vegetables (root vegetables, cabbage, cauliflower, etc.) by 21.8 %. Market price decrease owed mainly to price drop in 'recreation and culture' resulting from lower prices of electronic equipment for the reception, recording and reproduction of sound and pictures, photographic and cinematographic equipment (-6.3%) and personal computers (-3.0%). Lower were also prices of motorcars by 1.5% and motorcycles by 3.2%. In food, a drop was recorded mainly for seasonal prices of stone fruit and soft fruit (-28.1%), other kinds of fruit (-6.4%), eggs (-7.8%), cheese (-2.6%) and butter (-4.8%).
The average m-o-m growth in Q2 2008 was 0.3%.
In the year-on-year development the consumer price level was stabilized while despite a modest drop prices remained relatively high. In Q2 2008 compared with Q2 2007 a 6.8% increase in consumer prices was recorded which is by 0.6 percentage point less compared to Q1. The regulated price *) goods and services whose prices are partly or entirely regulated and indirect tax adjusted ) growth slowed down to 21.5% (from 23.8% in Q1 2008) and market price growth decelerated to 3.3% (from 3.6% in Q1 2008).
A slowdown in the y-o-y growth was recorded in Q2 primarily in ' alcoholic beverages and tobacco' where the y-o-y growth of tobacco prices decelerated to 14.3% (from 23.0% in Q1) due to continuing price growth of cigarettes in Q2 2007 (the average growth rate was 2.3%) while in Q2 2008 (despite an increase of the excise tax on cigarettes from January 2008) prices of cigarettes showed no increases (average growth rate was 0.3%).
A slow-down of the y-o-y price growth reflected also in ' food and non-alcoholic beverages' yet the y-o-y price increase for many kinds of food remained significant . Prices of bread were 25.3% up (in Q1 +32.5%) and prices of rolls and baguettes increased by 26.5% (in Q1 + 30.4%). Prices in the product group including milk, cheese, eggs rose by 17.7% (in Q1 by 21.2%), prices of butters were 12.3% up (in Q1 + 18.1%) and prices of poultry increased by 14.9% (in Q1 + 20.1%). Seasonal prices of fruit went up by 13.7% (in Q1 + 18.8%). In contrast, for some kinds of food the present big price growth has even strengthened. Prices of flour rose by 55.5% (in Q1 by 46.4%), prices of rice by 28.9% (in Q1 by 16.1%) and prices of vegetable oils by 22.3% (in Q1 by 13.4%).
In ' health' a big price growth (coming from patients´ expenses on new introduced regulatory fees in health care from January 2008) was recorded due to an increased amount paid by patients for drugs in Q2 2007.
In transport, the y-o-y slowdown of price development came -besides fuel prices- also from prices of motorcars and motorcycles. Fuel prices recorded an average m-o-m growth in Q2 2008 by 2.4%. However, in Q2 2007 prices grew faster (average m-o-m growth was 3.3%) which resulted into a slow-down of the y-o-y price growth of fuel in Q2 to 8.5% from 14.3% in Q1 2008. Prices of automotive fuel reached in June maximum level in its history and higher prices of different kinds of petrol compared to June 2008 were reached only in September 2005. Price drop in motorcars and motorcycles became a little more profound in Q2, reaching 2.6% and 3.1%, respectively. In contrast, prices in public transport went up by 10.8% while in Q1 by 9.7%.
Development of consumer prices of fuel like import prices of mineral fuels and industrial producer prices of refined petroleum products responded to soaring world oil prices. Strengthening of the CZK exchange rate against USD had a favourable impact on fuel prices.
In ' housing, electricity, water and other fuels' price growth speeded up mainly due to the natural gas price increase by 2.9% in April 2008 which resulted in the y-o-y growth in Q2 to 18.4% from 16.5% in Q1. Net rentals increased by 16.9% of which for dwellings with regulated rentals by 28.3% and for dwellings with market rentals by 1.7%. Prices of electricity increased by 9.5%, prices of heat and hot water by 11.3% and prices solid fuels by 20.2%. Prices of water supply and sewerage water charges were up by 8.3% and 9.1%, respectively.
In ' hotels and restaurants' the price growth owed mainly to the VAT increase in food and meals provided in restaurants in January 2008. Prices of meals served in restaurants increased by 6.5%, in canteens by 8.6% and school canteens by 10.7%.
The y-o-y price drop occurred in clothing and footwear, where prices of clothes decreased by 2.2%. Despite an increase in prices of postal services from January 2008, a price decline occurred in 'post and telecommunications' owing to price decrease in mobile phones and price reductions offered by mobile phone operators.
Price increase of goods in total slowed down to 6.0% (from 7.3% in Q1 2007) and prices of services speeded up to 7.9% (from 7.6% in Q1).
Harmonized index of consumer prices in the EU27
According to preliminary data, the year-on-year increase in the average harmonized index of consumer prices (HICP) in the EU27 was 3.6% in April and 4.0% in May. Prices grew most in Latvia (by 17.4% and 17.7%) and in Bulgaria (by 13.4% and 14.0%). The lowest inflation was registered in the Netherlands (1.7% and 2.1%). In Slovakia the price growth was 3.7% and 4.0%, respectively. In Germany the HICP in the above months was 2.6% and 3.1%. In the CR the y-o-y HICP was 6.7% in April, 6.8% in May and according to preliminary results it slowed down in June to 6.6% which are values significantly exceeding the average reported for the EU27. In most of the EU countries the y-o-y HICP increases were recorded from January while in the CR the trend for these values was just opposite.
*) goods and services whose prices are partly or entirely regulated and indirect tax adjusted