Development of consumer price indices - 1. quarter of 2008
Product Code: e-7132-08
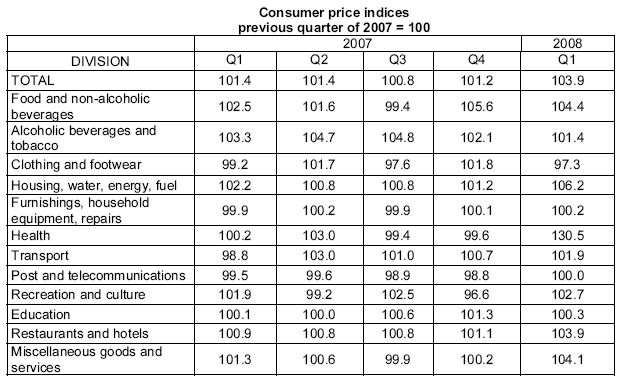
Consumer prices increased in Q1 2008 compared with Q4 2007 by 3.9% of which regulated prices by 15.5% and market prices by 1.0%.
Consumer prices in Q1 were strongly affected by the development in January when prices increased by 3.0%, m-o-m, to record the largest m-o-m price growth for the last ten years. This increase in the amount of 2.9 p.p. came from administrative measures including mainly the increase of regulated prices in housing, VAT rate growth from 5 to 9% and introduction of regulatory fees in health care. The VAT rate increase reflected mainly on 'food and non-alcoholic beverages', 'transport', 'hotels and restaurants' and 'miscellaneous goods and services'. The contribution of VAT change to the m-o-m aggregate increase of consumer price index in January was, according to the CZSO preliminary calculations, 1 p.p. In other months of Q1 the price development was qualified as standard. In February, the m-o-m consumer price increase was the same as in February 2007. In March, compared to March 2007, a modest drop of price level was observed.
In 'housing, water, electricity and other fuels’ in Q1 2008 compared to Q4 2007 the price increase was recorded for electricity (9.5%), natural gas (7.8%), heat and hot water (8.7%), water supply (6.7%), sewerage collection charges (7.4%). Net rentals rose by 12.0 % of which in dwellings with regulated rentals by 19.5 % and in dwellings with market rentals by 0.8%. In 'food and non-alcoholic beverages' prices of all kinds of food increased, however, some kinds of food began to show a downward trend in February and March. Higher were mainly seasonal prices of fruit by 9.5% and vegetables incl. potatoes by 3.5%. Prices of bread and cereals increased by 7.1% of which prices of bread by 9.4%, rolls and baguettes by 6.8%, flour by 10.6%, rice by 11.2%. In dairy products higher were prices of cheese, yoghurts and other dairy products, by 2.4%, 3.9% and 3.2%, respectively. Higher were also prices of chocolate and chocolate products (4.4%), confectionery (4.8%), non-alcoholic beverages (5.3%) and prices of different spices. So far stagnating prices of meat increased by 1.6% due to a 3.1 price rise of beef while prices of pork were 0.2% down. In transport prices of transport services were 9.4% up of which prices in bus transport by 9.7% and in combined city transport by 13.2%. Prices of fuel were 0.7% up. In 'hotels and restaurants' higher were mainly prices of meals in restaurants by 3.2%, in canteens by 6.2%, school canteens by 7.1%. Prices of accommodation services increased by 3.3%. In 'other goods and services' prices in 'hairdressing and other beauty treatment' increased by 6.1% and the increase was also contributed to by cancellation of funeral grant. In 'health' the introduction of regulatory fees took a notable effect (a 0.5 p.p. contribution to the m-o-m aggregate increase of consumer price index in January). In ’recreation and culture' the price growth came from a 4.4% increase of holiday prices and a 12.5% increase of TV licence fee. The drop of price level came from lower prices of clothes by 2.6% and footwear by 2.8% due to sales of mainly winter models and from lower prices of household appliances, personal cars, electronic equipment for the reception, recording and reproduction of sound and pictures, photographic and cinematographic equipment and personal computers. In 'food and non-alcoholic beverages' lower were especially prices of butter (-8.2%), citrus fruit (-1.5%) and vegetables grown for fruit (-0.5%).
The average m-o-m growth in Q1 2008 was 0.1 % while in Q4 the 2007 the growth was 0.7%.
A price-jump in January affected also the y-o-y consumer price development. Consumer prices increased in Q1 2008 compared to Q1 2007 by 7.4% of which in January and February by 7.5%. This was the biggest y-o-y growth for the last ten years. The growth of regulated prices accelerated to 23.8% (from 13.0% in Q4 2007) and market prices speeded up to 3.6% (from 3.2% in Q4 2007).
Administrative measures affecting the growth of regulated prices included the VAT rate increase from 5 to 9% mainly in 'food, non-alcoholic beverages and tobacco', in public transport and food service activities.
In ' food and non-alcoholic beverages' further speed-up of price growth was recorded in Q1 which culminated in January and slowed down in the following two months. Even so, for most kinds of food the y-o-y price growth in Q1 was more notable compared to Q4 2007. Prices of bread and cereals were higher by 22.8% on average (in Q4 by 15.2%) of which prices of bread increased by 32.5% (in Q4 by 21.8%) and prices of baguettes and rolls by 30.4% (in Q4 19.6%). Prices of milk, cheese and eggs increased by 21.2% (in Q4 by 17.7%) and prices of non-alcoholic beverages by 6.5% (in Q4 by 3.1%). In contrast, prices of butter were higher by 18.1% (in Q4 by 29.7%). Seasonal prices of fruit went up by 18.8% (the same as in Q4) and prices of vegetables incl. potatoes by 2.6% in Q4, while in Q1 they were 9.5% down.
Acceleration of the y-o-y price development in transport came, in addition to prices of fuel, also from prices in public transport services. In Q1 2008 prices of fuel raised by 14.3% while in Q4 2007 they recorded a 8.5% increase, y-o-y. Prices of transport services rose in Q1 by 9.7% (in Q4 by 1.8%). Lower than a year ago were prices of cars and motorcycles.
As it is clear from the graph, the y-o-y growth of consumer prices of fuel corresponded with price development of the world prices of crude oil, import prices of mineral fuels and industrial producer prices of refined petroleum products, however, it did not reach the level of their increase.
In 'hotels and restaurants' higher prices of food and higher VAT raised prices of meals provided in restaurants by 5.8%, in canteens by 8.0% and school canteens by 9.5%.
In ' housing, electricity, water and other fuels' the price growth speeded up mainly due to the increase of all items related to housing in January. Net rentals rose by 17.6% of which in dwellings with regulated rentals by 29.3% while in dwellings with market rentals a 1.1% price drop was recorded. Higher were prices of natural gas by 16.5%, electricity by 9.5 %, heat and hot water by 11.2%, solid fuels by 20.4%. Water supply and sewerage collection charges were higher by 6.8 and 7.3%, respectively.
A significant price increase in ' health' came from payments for newly introduced regulatory fees per visit to a doctor, per using a medical emergency facility, per prescription, per day spent in hospital. High price growth in 'health' (by 33.1%) was affected also by so far low level of the population payments for healthcare.
' Alcoholic beverages and tobacco' is the only segment of the consumer basket reporting a slow-down of price growth in Q1. The y-o-y price growth of tobacco manufactures decelerated to 23.0% (from 28.4% in Q4). This slow-down came from a significant price growth of cigarettes in Q1 2007 (average growth rate 3.0%) which (despite the increase of excise tax on cigarettes since January 2008) did not occur in Q1 2008 (average growth rate 0.3%).
The y-o-y price drop was recorded in 'closing and footwear' where prices of clothes decreased by 2.6%. In spite of the price increase of postal services since January 2008, the y-o-y price decline was reported also for ' post and telecommunications' coming from lower prices of mobile phones and commercial price reductions offered by mobile operators.
Price increase of goods in total speeded up to 7.3% (from 5.7% in Q4 2007) and prices of services to 7.6% (from 3.4% in Q3).
Harmonized index of consumer prices in the EU27
According to preliminary data, the year-on-year increase in the average harmonized index of consumer prices (HICP) in the EU27 was in January and February 3.4%. Prices grew most in Latvia (by 15.6% and 16.5%) and in Bulgaria (by 11.7% and 12.2%). The lowest inflation was registered in the Netherlands (1.8% and 2.0%). In Slovakia the price growth was 3.2% and 3.4%, respectively. In Germany the HICP increase in the above months was the same, i.e. 2.9%. In the CR the y-o-y HICP was 7.9% in January, 7.6 in February and according to preliminary results it slowed down in March to 7.1% which values significantly exceeded the EU27 average.