Commentary on the development of average wages of employees - 2. quarter of 2005
Product Code: e-3134-05
Commentary on the development of average wages of employees*
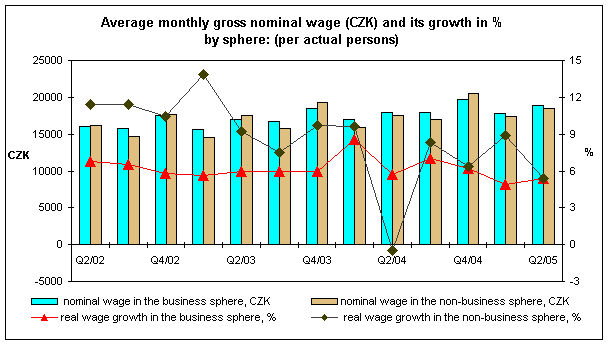
In Q2 2005, the average gross monthly nominal wage per actual person reached CZK 18 763 and its year-on-year increase amounted to CZK 965. In the business sphere the average wage increased by CZK 968 to CZK 18 863, while in the non-business sphere it went up by CZK 949 to CZK 18 425. The relative increase found for both spheres was identical, namely 5.4%, which is a rare case; consequently, the same increase applies nationwide. In the same period, consumer prices went up by 1.6% and the real wage thus rose by 3.7% in both spheres and in total.
Last years’ trend of slowing down the growth of average wage continued. Compared to the wage growth rates in individual quarters, the wage growth in Q2 2005 belonged to the lowest since the CR came into being. Only in one quarter of this long time interval was the growth rate even lower. It occurred in Q2 2004, when the wage growth fell into negative figures, and it was the lowest in the business sphere over the whole year, too.
Nationwide wage development is heavily shaped by the business sphere as employees of this sphere account for more than three quarters of the set of units under observation. While the wage development in the business sphere is rather fluent and affected by economic results of the companies, it is jump-like in nature in the non-business sphere because it depends to a large extent on legislative measures of the government and on what is permitted by the budget.
In previous years, wage differences between the business and non-business spheres usually became wider always in Q1 and Q3 of a given year—that is to say the average wage in the business sphere was higher than in the non-business one. In Q2 and Q4, the average wage levels then mostly converged, owing to half or a certain part of the additional salary regularly paid in the non-business sphere, and in some periods the wage level in the non-business sphere even exceeded the one in the business sphere.
Since the beginning of this year, the wage development has been influenced by adjustments to salaries and wages of employees in public services and administration. Apart from the normal year-on-year rise in average salaries, salaries in selected professions rose in a differentiated way. Government Regulation No. 637/2004, Coll. extended the circle of employees whose wage rates are provided according to the scale of increased wage rates (e.g. employees providing social care directly, employees in charge of administrative social care services, employees engaged in work on roads, collection and processing of municipal waste, etc). Furthermore, a new scale of increased wage rates was put in place for employees – members of the Police of the CR, the Prison Service of the CR, the Fire and Rescue Service of the CR, and the Customs Administration of the CR. On 1 January 2005, the payment of the additional salaries was cancelled. These latest wage adjustments in particular helped suppress rather large differences in the wage levels between individual quarters in the non-business sphere, and it is possible to expect that the wage development in this sphere will be smoother, with jumps, if any, caused to happen in response to legislative measures only.
While the Q1 2005 development of the average wage per actual person (an increase of 5.8%) was affected by a slower wage growth rate in the business sphere (+4.9%) and a faster growth rate in the non-business sphere (+8.9%), Q2 2005 saw quite a unique identical growth rate in both spheres by 5.4%. In comparison with Q1 2005 this implies that the wage growth in the business sphere accelerated slightly in Q2 2005 (by 0.5 percentage points) and slowed down quite markedly in the non-business sphere (by 3.5 percentage points).
Graph 1

Industry-to-industry wage differences became wider over the period under observation and the variation coefficient of average wages (by CZ-NACE division) reached 35.7%, 2.2 percentage points up on Q2 2004.
The wage development in January-June 2005 was characterized by an average wage of CZK 18 220 and a year-on-year increase of 5.6% (CZK 966). The average wage of employees in enterprises rose by 5.2% (CZK 898) to CZK 18 317, and in the non-business sphere it increased by 7.1% (CZK 1 187) to CZK 17 895.
Given the fact that the non-business sphere employs a higher proportion of part-time workers than the business one, the following comparisons are made with average wage data related to full-time equivalent (FTE) employees as these data take account of the length of work.
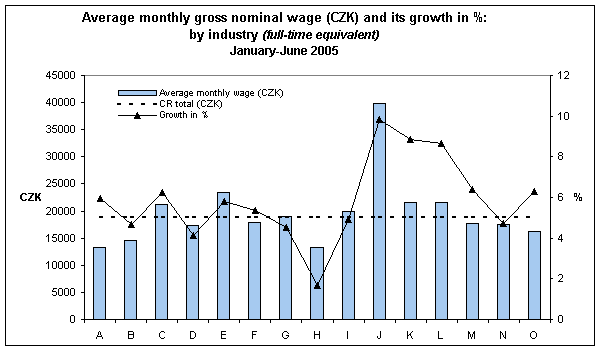
In Q2 2005, the average wage per FTE person increased by CZK 1 015 year-on-year (+5.5%) to reach CZK 19 365, rising to CZK 19 316 (+5.5%, CZK 998) in the non-business sphere and CZK 19 537 (+5.9%, CZK 1 079) in the non-business sphere. The real wage increased by 3.8% in total and in the business sphere and by 4.2% in the non-business sphere.
The relation of the average wage per FTE person in Q1 and Q2 is very similar to the wage related to actual person: over the whole of January-June 2005 period, the wage growth thus amounted to 5.7% (nominal wage being CZK 18 798) in the whole country, 5.2% (CZK 18 753) in the business sphere and 7.5% (CZK 18 955) in the non-business sphere. The real wage increased by 4.0% year-on-year and its increase is based on 3.5% growth in the business sphere and 5.8% growth in the non-business sphere.
Graph 2

| A | Agriculture, hunting and forestry | B | Fishing |
| C | Mining and quarrying | D | Manufacturing |
| E | Electricity, gas and water supply | F | Construction |
| G | Wholesale and retail trade; repair of motor vehicles, motorcycles and personal and household goods | H | Hotels and restaurants |
| I | Transport, storage and communications | J | Financial intermediation |
| K | Real estate; renting and business activities | L | Public administration and defence; compulsory social security |
| M | Education | N | Health and social work |
| O | Other community, social and personal service activities |
Comparisons of the wage development in industries made at the CZ-NACE division level (two-digit code) suggested that the following three industries (employing a minimum of 20 thousand people and excluding enterprises with less than 20 employees) paid the lowest average nominal wage per FTE person:
– manufacture of wearing apparel; dressing and dyeing of fur: CZK 10 554 (the average wage in this industry was CZK 8 244 down on the national average, the nominal or relative year-on-year rise being CZK +303 or +3.0%, respectively)
– manufacture of textiles and textile products: CZK 12 739 (CZK –6 059, CZK +501 or +4.1%).
– agriculture, hunting and related service activities: CZK 12 848 (CZK –5 950, CZK +708 or +5.8%)
On the other hand, the following were three industries (with the same criterion in force) paying the highest average nominal wage per FTE person:
– computer and related services: CZK 43 751 (the average wage in this industry was CZK +24 953 up on the national average, the nominal or relative year-on-year rise being CZK +3 851 or +9.7%, respectively)
– financial intermediation except for insurance and pension funding: CZK 42 709 (CZK +23 911, CZK +4 330 or +11.3%)
– electricity, gas, steam and hot water supply: CZK 25 861 (CZK + 7 063, CZK +1 662 or +6.9%).
The above-mentioned comparisons suggest that the January-June 2005 earnings of employees in the industry with the highest wage rose 3 times faster year-on-year and that the average wage of these employees was about 4 times higher than the average wage of employees in the industry paying the lowest wage. In the same period, inter-industry wage differences became wider year-on-year and the variation coefficient of average wages (by CZ-NACE division) reached 37.0%, which is 2.7 percentage points up on January-June 2004.
Manufacture of wood and wood products was the industry with the lowest growth or drop of real wage among industries employing at least 20 thousand people—the year-on-year drop in real wage was 1.0%. The average nominal wage in this industry increased only a little year-on-year (+0.6%); it reached CZK 14 273 and was CZK 4 525 below the national average.
Financial intermediation except for insurance and pension funding, in contrast, was the industry (rather significant in terms of employment) with the highest achieved growth of real wage—an increase of 9.5%.
The comparison of the wage development made for sectors suggests that the highest average wages are paid for a long time in financial institutions, insurance companies and pension funds. The January-June 2005 average wage per FTE persons in the financial institutions climbed up to 2.2 times as much as the national average, and the insurance companies and pension funds paid wages about 1.7 times the national average. In contrast, wages of employees in the sector of households (i.e. wages of unincorporated natural persons) are about one third below the average. In the sector of non-profit institutions serving households wages are about three quarters of the average wage in the whole of the CR. The average wage level is affected rather fundamentally by the non-financial corporations sector and the government sector, though. Employees of these sectors make up about 95% of the set of units measured.
*The data refer to business sphere enterprises with 20+ employees (in financial intermediation irrespective of the number of employees) and all non-business sphere organizations. They only refer to employees under employment contract with reporting units. Persons performing public office, such as members of Parliament, senators, full-time councillors at all levels, judges, etc. are excluded. Employees of the non-business sphere make up a quarter of all employees included in the quarterly survey.
