Analysis of the development of average wages of employees - 3 quarter
Product Code: q-3134-09
The results do not suggest that the labour market in the Czech Republic saw a revival. The development is still dominated by a dramatic y-o-y drop of the registered number of employees: in Q3 2009 the total of 279 thousand employees (-6.9%) were dismissed. The biggest loss of jobs was registered in industrial branches where 203 thousand employees, i.e. 14.9% were made redundant. In Q3 the drop of the number of employees in market services has either started or become more profound.
Total drop of employment is partly slowed down by the growth of employment in the non-business sphere; increases were registered mainly in 'health and social activities'; 'public administration and defence'; 'compulsory social security'. In 'public administration and defence' the growth owed to the relocation of part of the dismissed to social beneficial work.
Also the average hours worked continued to fall below the level reached in Q3 2008 – approximately by 2 hours monthly, however, in individual industries the development differed: while in majority of industries the situation has been already stabilized, declines continue in engineering and a sizeable drop of the average number of hours worked started to show in market services.
In wages a paradox growth was registered per employee on average (+4.8%) which, however, came mainly from transfers of employment structures reflecting the last year’s situation. As a result, employees with lower wages were dismissed and a drop of sickness rate (which affects the volume of wages in the numerator but it does not show in the registered number of employees in denominator of the average wage indicator) occurred. Significant wage increases were only exceptional due to unfavourable situation in majority of enterprises. On the other hand, only a small number of employers agreed to overall wage cuts, they preferred to reduce extraordinary remunerations and benefits instead.
Labour market crisis does not come to an end but it rather enters the second stage where impacts show in tertiary sectors of economy.
* * *
The real wage development is, in addition to the nominal wage growth, affected also by the growing price level (inflation) expressed by the consumer price index. In 2008 the inflation reached its top level in Q1 (7.4%), in the following quarters it gradually declined to reach 2.1% in Q1 2009, 1.4% in Q2 2009 and in Q3 even 0.1%. The total real wage in Q3 2009 increased, y-o-y, by 4.7%. While in the previous three years it grew faster in the business sphere (in 2008 the non-business sphere saw a real wage slump by 2 p.p.), in 2009 the situation was just opposite. In Q3 the business sphere saw an increase of the real wage by only 4.4% while the non-business sphere recorded a 5.5% growth.
Graph 1
Graph 2
The minimum wage showed no changes since January 2007 and accounts for CZK 8 000.
The nominal average gross monthly wage per natural persons in the sample survey 1 reached in Q3 2009 CZK 23 941, in the y-o-y comparison the increase made CZK 934, i.e. 4.1%. In the business sphere the average wage increased, y-o-y, by CZK 877 to CZK 24 232, in the non-business sphere by CZK 1 244 to CZK 22 967. In the business sphere the increase was 3.8%, in the non-business sphere 5.7%.
The difference between average wages calculated according to different concepts are due both to the inclusion of the below-limit businesses and also to the type of employment, full time equivalent, taken into the account (in the non-business sphere only the latter was observed).
Nationwide wage development is shaped mainly by the business sphere since its employees make more than 80%. While the wage development in the business sphere is used to be more fluent and is affected mainly by economic results of the companies, it is jump-like in nature in the non-business sphere because it depends on what the budget allows.
* * *
The differences in the wage level and its growth rate between individual industries ( CZ-NACE sections) are shown in the following graph.
Graph 3
| A | Agriculture, forestry and fishing | B | Mining and quarrying |
| C | Manufacturing | D | Electricity, gas, steam and air conditioning supply |
| E | Water supply; sewerage, waste management and remediation activities | F | Construction |
| G | Wholesale and retail trade; repair of motor vehicles and motorcycles | H | Transportation and storage |
| I | Accommodation and food service activities | J | Information and communication |
| K | Financial and insurance activities | L | Real estate activities |
| M | Professional, scientific and technical activities | N | Administrative and support service activities |
| O | Public administration and defence; compulsory social security | P | Education |
| Q | Human health and social work activities | R | Arts, entertainment and recreation |
| S | Other services activities |
In Q1-Q3 2009 the average wage in the national economy , FTE, in total, accounted for CZK 22 896, i.e. 3.6% up (CZK 796) compared to the corresponding period of 2008. In the business sphere the average wage increased by 3.3% (CZK 730) to CZK 22 784, in the non-business sphere by 4.8% (CZK 1 075) to CZK 23 398. Real average wage in the national economy increased by 2.4%, y-o-y, in the business sphere by 2.1% and in the non-business sphere by 3.6%.
The highest nominal average wage was observed in the first three quarters of 2009 in 'financial and insurance activities' (CZK 47 572) and 'information and communication' (CZK 42 390) where the wage increased by 3.4 %, y-o-y, in both divisions and also in 'electricity, gas, steam and air conditioning supply' (CZK 36 976) where the average wage increased by 8.9%, y-o-y. The lowest average nominal wage was observed in 'accommodation and food service activities' (CZK 12 795) where a portion of labour income is obtained in form of a tip. The second lowest wages were reported for 'administrative and support service activities' (CZK 16 432); 'agriculture, forestry and fishing' (CZK 17 189) occupies the third place. The industry with the lowest average wage ('accommodation and food service activities') recorded a 0.2% drop, y-o-y, and for other two industries with the lowest average wages the y-o-y growth ranged from 1.1 – 1.4% which is notably below the nationwide average (3.6%).
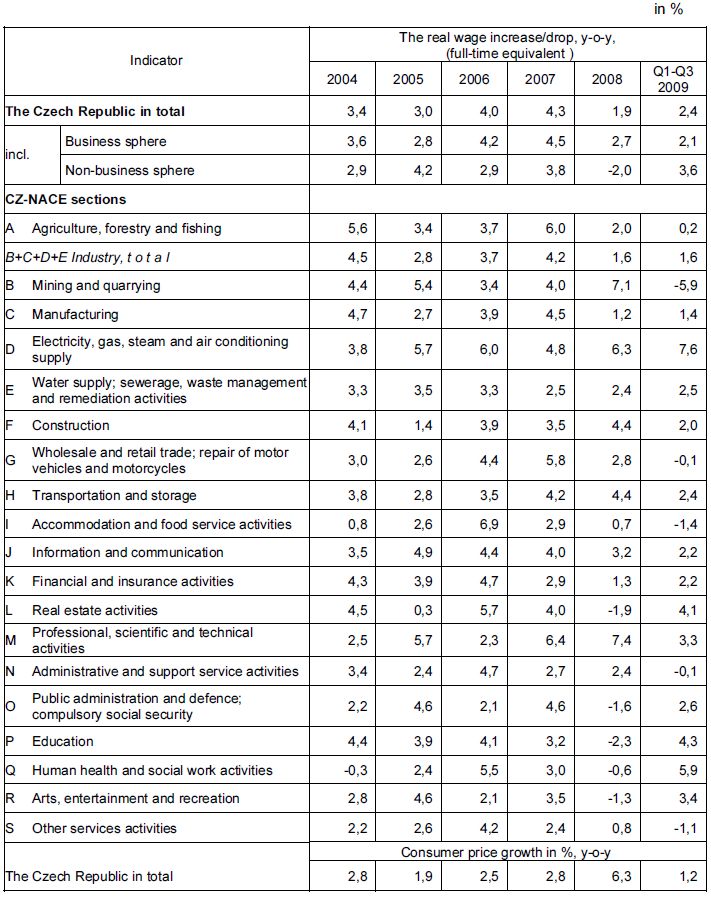
The drop of real wages was observed in the Q1-Q3 for those industries where nominal wages either declined, y-o-y, or grew more slowly than inflation. This applies to 'mining and quarrying' (drop of nominal wage by 4.8%, drop of real wage by 5.9%); 'accommodation and food service activities' (-0.2% and –1.4%); 'other related services' (nominal growth 0.1%, real drop by 1.1%); 'administrative and support service activities' and 'wholesale and retail trade; repair of motor vehicles and motorcycles' (both +1.1% and –0.1%). On the other hand, in addition of the expected wage increase in 'human health and social work activities' and 'education' (nominal growth by 7.2% and 5.6%, real growth by 5.9 % and 4.3% for both, with the wage level slightly below the nationwide average) the above-standard growth of the average wage in the already mentioned industry 'electricity, gas, steam and air conditioning supply' was recorded (+8.9% and +7.6%, by contrast, with the average nominal wage sizeably exceeding the nominal wage).
Details related to the real wage development are shown in the following table:
The y-o-y increases/drops of the real wage broken by industries ( CZ-NACE sections)
The average nominal wage in companies and organisations employing 250+ employees reached in Q1-Q3 2009 (FTE) CZK 26 471, of which in enterprises with 1000+ employees CZK 27 624. In enterprises employing 50-249 employees the average wage accounted for CZK 23 071, in enterprises with 20-49 employees CZK 21 402, in enterprises with 10-19 employees CZK 19 382 and in the smallest enterprises (up to 9 employees) CZK 15 758.
The y-o-y drop of wages (wages excl. other personnel expenses) was CZK 16.8 billion, which is by 2.1% less. Concurrently the number of employees decreased (FTE) by 5.5%.
__________________________
1 The data refer to business sphere enterprises with 20+ employees (in financial and insurance activities irrespective of the number of employees) and all non-business sphere organizations.